Follow the example
Choose a step to follow the example. Opening a request lets you review it; it does not submit a job or change your account.
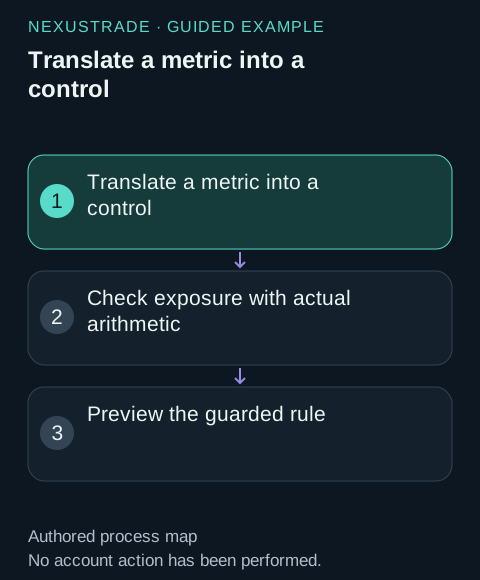
Calculate how much capital one holding uses
For an illustrative $10,000 account with $3,500 in one holding, Position Value divided by Portfolio Value is 35%. A proposed 25% cap permits $2,500 in that holding at these marks. Reducing $1,000 would remove 28.57% of the position's current value. Fees, price movement and share rounding can change the executable amount. This calculation describes concentration at a point in time. It does not prove a 25% cap is optimal or protect against correlated holdings. Check total exposure, cash and related positions, then review the exact order sizing before using a portfolio rule.
- Illustrative account / holding
- $10,000 / $3,500
- Exposure / proposed cap
- 35% / 25%
- Illustrative excess / trim
- $1,000 / 28.57% of current holding value
A state or allocation control, not a universal market-timing winner.
portfolio_value = 10_000
position_value = 3_500
proposed_cap = 0.25
assert portfolio_value > 0 and 0 <= proposed_cap <= 1
exposure_pct = 100 * position_value / portfolio_value
excess_value = max(0, position_value - proposed_cap * portfolio_value)
trim_pct = 100 * excess_value / position_value if position_value > 0 else 0
print(f'Exposure: {exposure_pct:.2f}%; excess: ${excess_value:,.2f}; trim: {trim_pct:.2f}%')
# Exposure: 35.00%; excess: $1,000.00; trim: 28.57%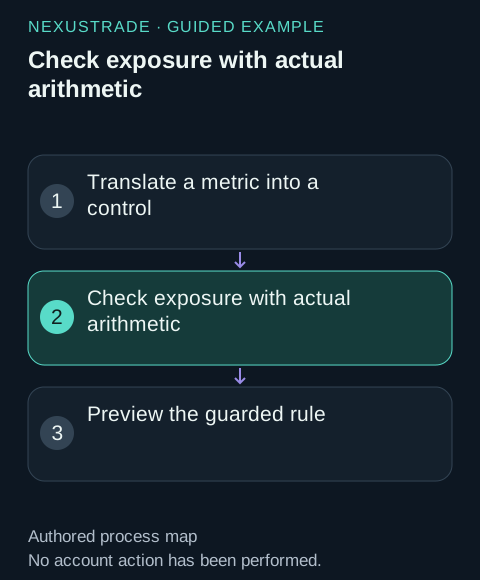
Check exposure with actual arithmetic
Compare position value with total portfolio value. A $2,500 position in a $10,000 portfolio is 25% exposure; a buying-power percentage uses a different denominator.
A visible denominator and an inspection of repeated evaluations, cash and remaining holdings.
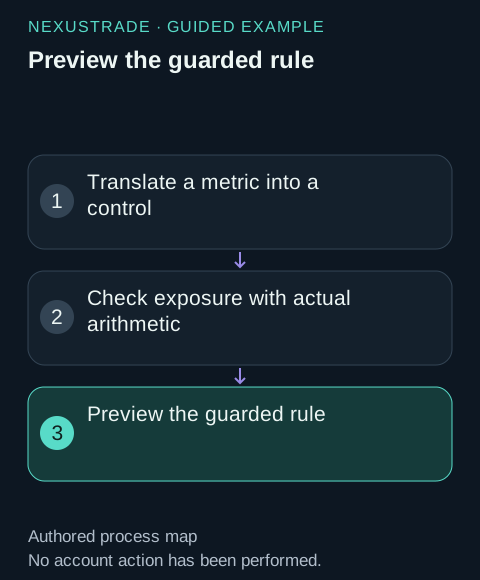
Preview the guarded rule
Ask Aurora to preview the exact position check, allocation and exit together. Keep held-position and empty-position branches explicit before saving.
A reviewable state-aware rule, with no implication that the corpus proves a universally best risk threshold.
What portfolio and position controls showed in the archive
Portfolio Value measures cash plus holdings. Position Value measures selected holdings. They can make allocation and holding guards explicit, which is different from predicting the next price move. The table describes whole strategies containing each control; it does not isolate the control's effect.
The same strategy can contain both controls. Assets, settings and periods differ, and the archive lacks complete exposure and closed-trade counts. A higher median here does not establish a universally best risk indicator or a controlled improvement from adding a guard.
Scroll sideways to compare all columns. Select a heading to sort.
| Portfolio Value | 1274 | 0.895 | 0.563 to 1.111 |
| Position Value | 10670 | 0.702 | 0.113 to 1.100 |
No matching rows. Clear the filter to see all records.
Calculate how much capital one holding uses
For an illustrative $10,000 account with $3,500 in one holding, Position Value divided by Portfolio Value is 35%. A proposed 25% cap permits $2,500 in that holding at these marks. Reducing $1,000 would remove 28.57% of the position's current value. Fees, price movement and share rounding can change the executable amount.
This calculation describes concentration at a point in time. It does not prove a 25% cap is optimal or protect against correlated holdings. Check total exposure, cash and related positions, then review the exact order sizing before using a portfolio rule.
portfolio_value = 10_000
position_value = 3_500
proposed_cap = 0.25
assert portfolio_value > 0 and 0 <= proposed_cap <= 1
exposure_pct = 100 * position_value / portfolio_value
excess_value = max(0, position_value - proposed_cap * portfolio_value)
trim_pct = 100 * excess_value / position_value if position_value > 0 else 0
print(f'Exposure: {exposure_pct:.2f}%; excess: ${excess_value:,.2f}; trim: {trim_pct:.2f}%')
# Exposure: 35.00%; excess: $1,000.00; trim: 28.57%
Inspect state controls in a saved strategy
Open a library recipe and inspect its actual saved indicators, conditions and actions. Identify the selected assets for each Position Value operand. Read Portfolio Value alongside buying power; a cash balance and the total account value answer different sizing questions.
Before testing a guard, write down its intended behavior: an empty-holding entry requires zero selected position value; an exit requires a positive holding. Check the comparison, selected assets and allocation basis in the complete rule. A familiar name or a high backtest score does not establish that those fields are correct.
Worked drawdown recovery calculation
This deterministic example explains the denominator. A 100% loss leaves zero equity and has no finite recovery percentage without new capital. Deposits can change account value without representing investment return.
Example only: equity peak = $10,000; trough = $8,000
Drawdown = ($10,000 - $8,000) / $10,000 = 20%
Recovery needed = ($10,000 / $8,000 - 1) = 25%
A further 20% gain reaches $9,600, not the previous peak.
Read each indicator with its denominator
Scroll sideways to compare all columns. Select a heading to sort.
| Sharpe | Return series, risk-free rate, observation frequency and annualization | A probability of profit or a forecast |
| Sortino | Downside return definition and sample size | Protection against an unobserved tail loss |
| Ulcer index | Depth and duration of drawdowns from equity peaks | All liquidity or broker execution risk |
| Closed-trade count | Completed positions underlying win rate and profit factor | Independent observations for every price row |
| Exposure and concentration | Capital deployed, holdings and common underlying risk | Diversification from strategy labels alone |
| Fees and turnover | Modeled costs, order sizes and traded notional | Actual broker fills or market impact |
No matching rows. Clear the filter to see all records.
Compare matched windows before ranking books
Use the same capital, fees, interval, date boundaries and dividend treatment for the candidate and baseline. Do not compare a daily equity statistic with an intraday trade statistic without reconciling their construction. Keep missing/nonfinite results visible rather than replacing them with a favorable score.
Turn indicators into a review decision
Write risk and activity requirements before selecting candidates. Then inspect each fold, warning and path against those requirements. A portfolio that fails the requirement is still useful research evidence, but a best-available fallback does not automatically pass. Follow a frozen design with paper observation of fills, positions and cadence before drawing operational conclusions.