TL;DR
Max Drawdown had the highest median Sharpe among qualifying technical price indicators in the September 2026 archive, followed by simple moving average and rate of change. SMA’s 11,800 recorded contracts had median Sharpe 0.577, with losses represented in the distribution. The analysis retains 42,850 distinct daily stock execution contracts. Scores describe complete strategies with different assets, dates and rules, so they suggest research questions rather than proving that adding an indicator improves returns.
- Recorded source runs
- 222,010
- Retained stock contracts
- 42,850
- Newest retained source record
- 2026-09-06
The observed distribution
Moving-average strategies included losses as well as gains
The 11,800 recorded contracts containing a simple moving average have median Sharpe 0.577. Their middle half runs from -0.247 to 0.966, and median drawdown is 25.99%. The distribution includes weak outcomes; using an average does not guarantee a good strategy.
These measurements belong to complete strategies containing the indicator. Their assets, other rules and dates differ, so the ranking cannot isolate the effect of adding that indicator. Sharpe is a historical risk-adjusted ratio; drawdown is a fall from an equity peak.
Which indicators are worth investigating?
We reanalyzed the available NexusTrade archive on 2026-10-10. It contains 222,010 recorded backtests, with the newest retained record dated 2026-09-06. This is an October analysis of the available September archive; October runs have not been added to this source.
The daily stock cohort contains 102,781 eligible runs and 42,850 distinct normalized execution contracts after deduplication. 28 built-in types meet the 500-contract floor. This receipt publishes only types meeting that floor; it does not rank rarer types.
A type counts once per normalized book when it appears in a condition or an action metric or weight. Each score describes the complete containing strategies. Assets, periods and other rules differ. A high median points to a research question; it does not prove that adding the indicator improves a strategy.
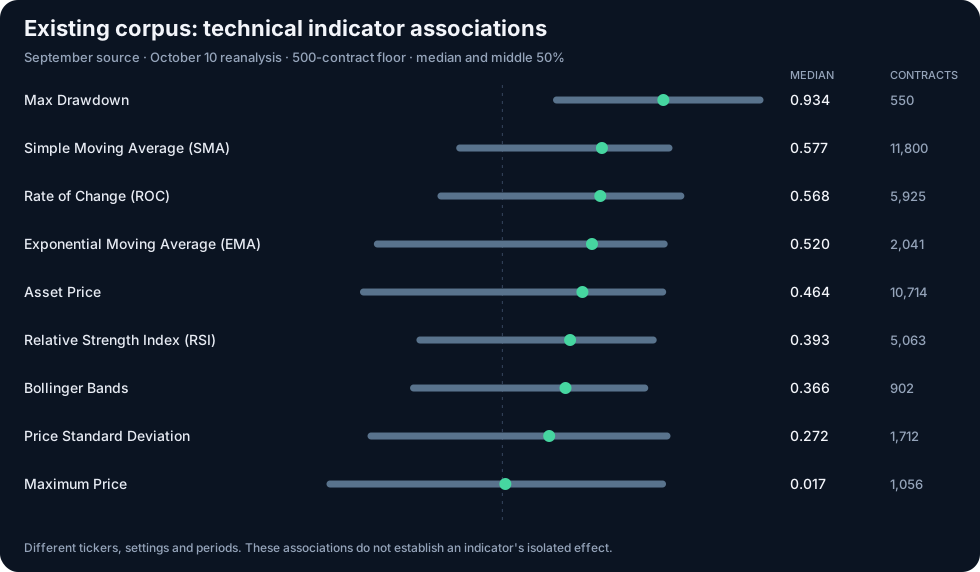
Five highest median Sharpes among technical price indicators
Tick: recorded median Sharpe. Shaded whisker: recorded middle 50% of Sharpe, not a confidence interval. Counts are distinct execution contracts.
Descending observed median Sharpe within the admitted technical category. The middle 50% describes dispersion, not a confidence interval.
Show the table · 5 rows, 6 columns
Scroll sideways to compare all columns. Select a heading to sort.
| Max Drawdown | Volatility Indicators | 550 | 0.934 | 0.314 to 1.495 | 26.25% |
| Simple Moving Average (SMA) | Moving Averages | 11,800 | 0.577 | -0.247 to 0.966 | 25.99% |
| Rate of Change (ROC) | Momentum Indicators | 5,925 | 0.568 | -0.356 to 1.035 | 26.13% |
| Exponential Moving Average (EMA) | Moving Averages | 2,041 | 0.520 | -0.725 to 0.939 | 30.12% |
| Asset Price | Price Indicators | 10,714 | 0.464 | -0.806 to 0.930 | 22.77% |
No matching rows. Clear the filter to see all records.
Descending observed median Sharpe within the admitted technical category. The middle 50% describes dispersion, not a confidence interval.
Five lowest median Sharpes among technical price indicators
Tick: recorded median Sharpe. Shaded whisker: recorded middle 50% of Sharpe, not a confidence interval. Counts are distinct execution contracts.
Show the table · 5 rows, 6 columns
Scroll sideways to compare all columns. Select a heading to sort.
| Maximum Price | Price Indicators | 1,056 | 0.017 | -1.000 to 0.929 | 14.91% |
| Price Standard Deviation | Volatility Indicators | 1,712 | 0.272 | -0.762 to 0.955 | 19.72% |
| Bollinger Bands | Volatility Indicators | 902 | 0.366 | -0.515 to 0.826 | 22.99% |
| Relative Strength Index (RSI) | Momentum Indicators | 5,063 | 0.393 | -0.478 to 0.875 | 23.85% |
| Asset Price | Price Indicators | 10,714 | 0.464 | -0.806 to 0.930 | 22.77% |
No matching rows. Clear the filter to see all records.
9 price-derived types meet the floor. The highest-five and lowest-five lists can overlap when fewer than ten types qualify; they do not imply ten distinct candidates.
A low Sharpe does not prove an indicator is useless. Settings and buy/sell uses vary across containing strategies. A recorded negative Sharpe can accompany a positive total return. Inspect the recorded risk-free assumption before interpreting it.
All admitted types, with their actual categories
Tick: recorded median Sharpe. Shaded whisker: recorded middle 50% of Sharpe, not a confidence interval. Counts are distinct execution contracts.
Showing 12 of 28 recorded rows. The complete table is below.
Show the table · 28 rows, 6 columns
Scroll sideways to compare all columns. Select a heading to sort.
| Max Drawdown | Volatility Indicators | 550 | 0.934 | 0.314 to 1.495 | 26.25% |
| Portfolio Value | Portfolio-Level Indicators | 1,274 | 0.895 | 0.563 to 1.111 | 24.31% |
| Compound Annual Growth Rate (CAGR) | Growth Indicators | 722 | 0.876 | 0.175 to 1.467 | 22.56% |
| Constant (Number) | Price Indicators | 40,936 | 0.722 | 0.154 to 1.105 | 24.05% |
| Is Asset | Boolean / Metadata Indicators | 1,253 | 0.712 | -0.207 to 1.196 | 21.79% |
| Position Value | Position Indicators | 10,670 | 0.702 | 0.113 to 1.100 | 20.06% |
| Days Since Order | Order Indicators | 18,928 | 0.697 | 0.044 to 1.082 | 23.93% |
| Position Percent Change | Position Indicators | 6,166 | 0.622 | -0.298 to 1.039 | 18.73% |
| Multiply (×) | Mathematical Operators | 4,412 | 0.615 | -0.518 to 1.066 | 24.78% |
| Trailing Sum | Compound Indicators (Indicators of Indicators) | 603 | 0.597 | -0.352 to 1.108 | 17.82% |
| Plus (+) | Mathematical Operators | 2,217 | 0.595 | -0.440 to 1.134 | 20.70% |
| Last Order Price | Order Indicators | 691 | 0.581 | -1.000 to 0.874 | 20.43% |
| Simple Moving Average (SMA) | Moving Averages | 11,800 | 0.577 | -0.247 to 0.966 | 25.99% |
| Rate of Change (ROC) | Momentum Indicators | 5,925 | 0.568 | -0.356 to 1.035 | 26.13% |
| Fundamental Metric | Fundamental Metrics | 3,993 | 0.563 | -0.393 to 1.142 | 19.79% |
| Divide (÷) | Mathematical Operators | 1,870 | 0.557 | -0.379 to 1.067 | 21.69% |
| Exponential Moving Average (EMA) | Moving Averages | 2,041 | 0.520 | -0.725 to 0.939 | 30.12% |
| Asset Price | Price Indicators | 10,714 | 0.464 | -0.806 to 0.930 | 22.77% |
| Index level | Market indices | 579 | 0.455 | -0.820 to 1.068 | 19.32% |
| Relative Strength Index (RSI) | Momentum Indicators | 5,063 | 0.393 | -0.478 to 0.875 | 23.85% |
| Rate of Change of Indicator | Compound Indicators (Indicators of Indicators) | 959 | 0.384 | -1.000 to 1.011 | 22.54% |
| Bollinger Bands | Volatility Indicators | 902 | 0.366 | -0.515 to 0.826 | 22.99% |
| Minus (−) | Mathematical Operators | 1,801 | 0.277 | -1.000 to 0.919 | 18.75% |
| Price Standard Deviation | Volatility Indicators | 1,712 | 0.272 | -0.762 to 0.955 | 19.72% |
| Maximum Price | Price Indicators | 1,056 | 0.017 | -1.000 to 0.929 | 14.91% |
| Position Max Drawdown | Position Indicators | 516 | -0.046 | -1.000 to 0.811 | 16.42% |
| SMA of Indicator | Compound Indicators (Indicators of Indicators) | 1,224 | -0.106 | -1.000 to 0.749 | 14.87% |
| Cross Above | Crossover Indicators | 674 | -0.122 | -1.000 to 0.620 | 11.55% |
No matching rows. Clear the filter to see all records.
Portfolio value and position value inspect account state. Days since an order or strategy fired inspect timing. Max Drawdown measures an asset's windowed price decline; Position Max Drawdown measures the held position's unrealized P&L. Constants and arithmetic operators build conditions rather than independently signaling a trade. Keep those distinctions when reading this mixed table.
What the leading price indicators measure
The type-level ranking combines different windows and thresholds. A 20-day SMA and a 200-day SMA share a type but answer different questions. Inspect a setting and its entry or exit role before using the result.
Sharpe and Sortino are stored unitless outputs; this analysis does not recompute them. Recorded risk-free values vary in apparent units and remain distinct in deduplication, so consistent Sharpe conventions are not established. Return and drawdown are percentages; benchmark alpha is a percentage-point difference. Sparse benchmark coverage appears per type in the JSON. Returns across different run durations are not directly comparable.
Max Drawdown
The maximum peak-to-trough percentage decline over a window. Measures worst-case downside risk.
Simple Moving Average (SMA)
The average closing price over a specified number of periods.
Rate of Change (ROC)
Measures the percentage change in price between the current price and the price N periods ago.
Exponential Moving Average (EMA)
Like SMA but gives more weight to recent prices, making it more responsive to new information.
Asset Price
The current market price of any asset.
Reproduce the analysis
Reproduce the analysis
Include equity-classified daily records without options, lasting 365 through 2,000 days, with finite Sharpe. Exclude records labeled optimizer. Every retained author's origin is unknown. Excluding known optimizers does not prove that these records were human-authored or never optimized.
Include zero-return records: 3,013 remain. The archive's traded flag is a nonzero-return proxy. Closed-trade counts, exposure, failed-job denominators and selected optimizer-winner flags are unavailable.
Normalize complete typed conditions and actions, retaining thresholds, windows, assets, logical order and allocation sizes. Remove verified editor metadata and exclude unsupported or incomplete records. Deduplicate the normalized book plus recorded tickers, dates, capital, fees, cadence, interval, benchmark and risk-free assumption. Keep the latest representative with a stable tie-breaker. Historical dividend, fill and engine-policy versions are absent.
Count a type once across condition and action operands in each retained contract and require 500 contracts before ranking its median. Interquartile ranges describe variation in outcomes and do not establish statistical separation. Source object HEAD revisions matched before and after the read; they do not certify an atomic multi-table publication generation. The archive has already undergone its historical export filters and cannot represent excluded or failed jobs.
Which analysis are these numbers from?
These tables use typed-rule-action-execution-v2, the same 42,850-contract population as the current condition and strategy analysis. 12,233 eligible inputs were excluded because their recorded execution fields or normalized rules were incomplete or unsupported. Repeated supported submissions are then deduplicated.
The earlier October exact-stored-JSON analysis retained 61,340 contracts. It preserved editor metadata and used the archived indicator projection. The current version removes verified editor metadata and reads membership directly from normalized conditions and action operands. Different populations and membership definitions produce different associations; comparing the medians does not measure a change in market performance.
Keep the September article's findings dated
The September 7 article used a different population and bootstrap intervals. This analysis fixes stock class and daily cadence, includes zero returns, preserves execution-input differences and selects a deterministic latest representative. The two tables are separate analyses; their differences do not show changing market performance.
No comments yet.