TL;DR
The strongest-ten monthly momentum implementation returned 58.01% versus matched SPY's 33.44% from January 2025 through October 6, 2026, after modeled fees. Its drawdown was deeper, 35.04% versus 19.92%, and daily-close Sharpe was lower. The 2022-start book also gained more overall but lagged in 2023 and 2025. This retrospective historical model uses finite ranking inputs; copying its inactive snapshot does not install an ongoing feed.
- January 2022 start
- +100.82% after fees
- January 2025 start
- +58.01% after fees
- Recent model drawdown
- 35.04%
- Recent SPY drawdown
- 19.92%
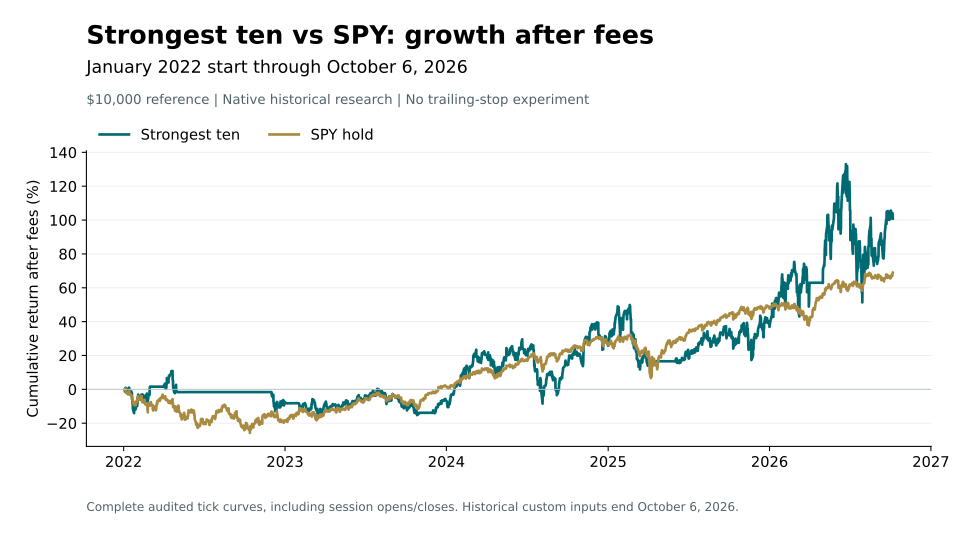
January 2022 onward
- Strongest ten 2026-10-06, 16:00:00 EDT
- 100.82
- SPY hold 2026-10-06, 16:00:00 EDT
- 68.93
Cumulative return (%)
Use the line buttons to compare the strategy with its recorded controls. Then switch to drawdown to inspect the losses behind the return.
- First recorded mark
- Jan 3, 2022 · 09:30:00 NY
- Last recorded mark
- Oct 6, 2026 · 16:00:00 NY
- Vertical axis range (percent)
- -25.77 to 133.03
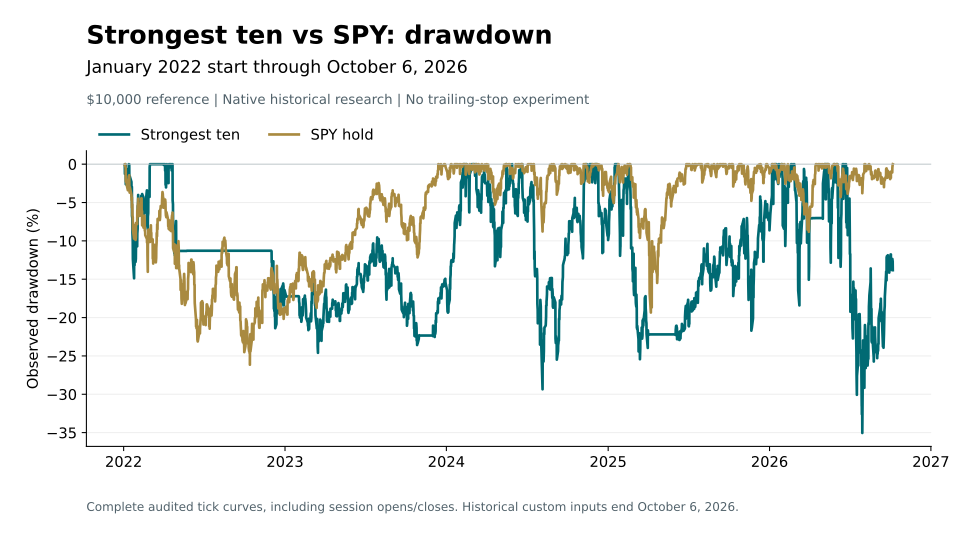
The model finished at $20,081.85 versus SPY's $16,893.03. This almost-five-year result includes a weak 2023 and 2025, not just the 2022 decline. The model's 35.04% drawdown was deeper than SPY's 26.15%.
- Strongest ten 2026-10-06, 16:00:00 EDT
- -13.82
- SPY hold 2026-10-06, 16:00:00 EDT
- 0
Below the prior peak (%)
Choose the lines whose losses you want to compare. Hiding a line changes this view only; the recorded dates and chart scale stay fixed.
- First recorded mark
- Jan 3, 2022 · 09:30:00 NY
- Last recorded mark
- Oct 6, 2026 · 16:00:00 NY
- Vertical axis range (percent)
- -35.04 to 0.00
Zero is a prior high; -10 means 10% below that book’s prior peak. Compare losses over the same recorded window; these marks do not measure every intraday extreme.
More upside, with more pain
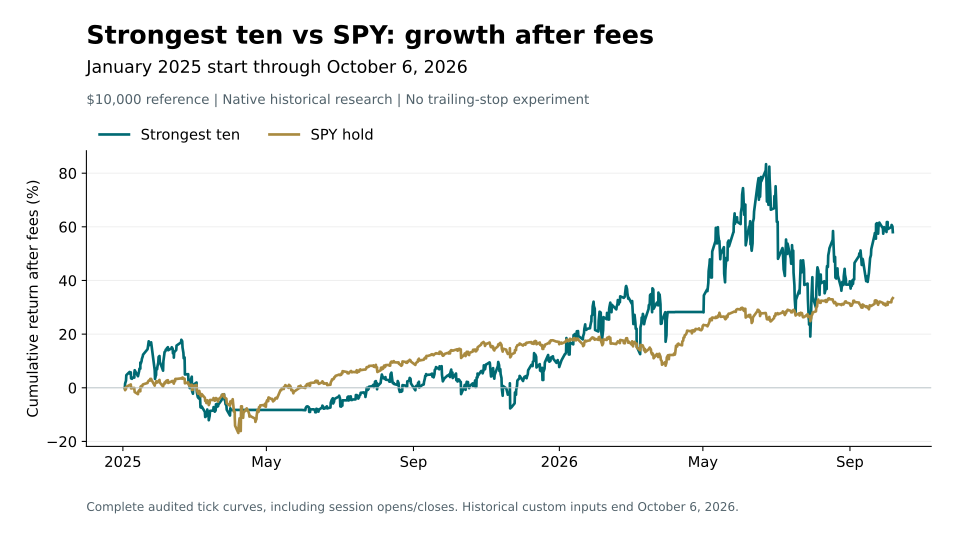
Nick Radge's public strongest-ten model buys the leaders in a historical stock universe once a month. Our native implementation returned 100.82% after modeled fees from January 3, 2022 through October 6, 2026, versus 68.93% for holding SPY. From January 2, 2025, it returned 58.01% versus SPY's 33.44%.
The extra return came with a larger loss below the peak. The recent model drawdown was 35.04%, compared with 19.92% for SPY. Its measured daily-close Sharpe was lower in both windows. This is a concentrated momentum return/risk trade-off; the index gate did not protect it from a collapse in its selected stocks.
These are four completed native historical studies, not the performance of an empty paper account. The windows overlap, and the model was developed retrospectively. They do not establish independent out-of-sample superiority, reproduce Radge's proprietary service or imply his endorsement.
What the actual trades explain
Read the explanation
The recent book's largest positive marked contribution was MU, $1,786.46, followed by SNDK at $984.36, STX at $914.08 and WDC at $824.42. These include realized cash flows and remaining marked positions, after the attributed fees and paid distributions. They are not isolated trade returns or a claim that one stock caused the full strategy gain.
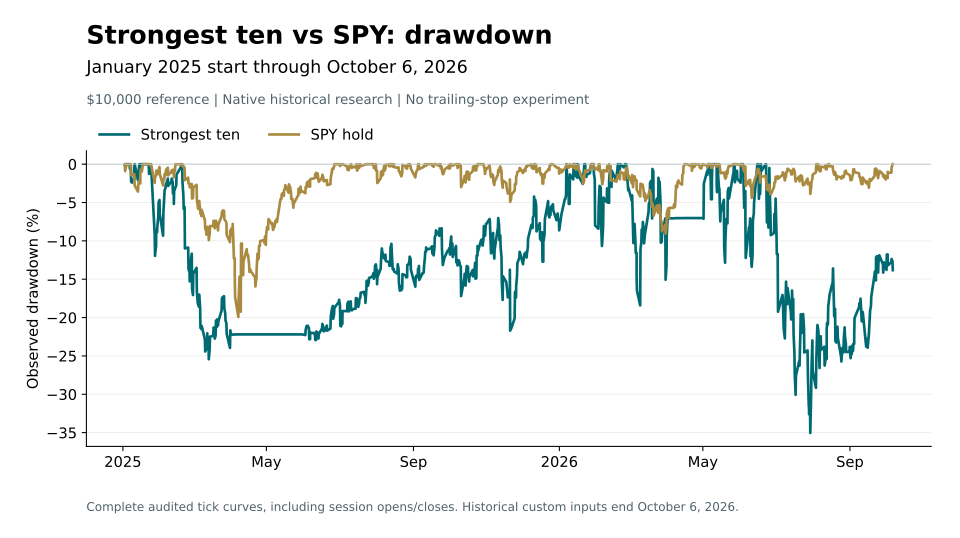
The recent book fell from $18,335.67 on June 22, 2026 to $11,909.96 on July 29: the 35.04% drawdown. The monthly exit can be slow. Its GLW holding cycle from July 1 to August 3 lost $719.98 after fees. SMCI's November 3 to December 1, 2025 cycle lost $399.86. These are actual native marks and orders. The market gate observes the broad index; it does not cap losses in an individual selected name.
All 58 expected monthly actions in the 2022-start book and 22 in the recent book were matched to the frozen targets. The public evidence includes those target weights, every attributed holding cycle and per-symbol cash/marked contributions. Earlier local price-only research and its separate 20% trailing-stop experiment remain outside this native result; no stop was added to the public original graph.
The public rules and our implementation
Show the table · 8 rows, 2 columns
| Component | Tested contract |
|---|---|
| Membership and ranking | Frozen point-in-time historical membership and 240-session price rankings; not today's constituent list |
| Selection | Ten equally weighted share classes when the SPY trend gate is positive; otherwise cash |
| Native data scope | SpecificAssets union of 106 canonical names; this union scopes loading and does not calculate ranks |
| Custom inputs | Asset-scoped targets plus a date-permission series, read back completely and checked against each actual monthly action |
| Clock | Completed month-end data, followed by the next actual regular-session open at 09:30 New York time |
| Identity | Both eligible share classes remain; FOX and FOXA both appear in March 2025. Verified SATS/ECHO mapping is identity bookkeeping. |
| Costs and cash | 0.1% per filled notional, fractional shares and 1.5% reserve. Native distributions stay cash, no DRIP or interest. |
| Finite source | Historical inputs end October 6, 2026. Current-session/date guards reject carried values after expiry. |
No matching rows. Clear the filter to see all records.
Radge's March 12, 2018 article ranks historical S&P 500 constituents by their past 240-day price return, holds the ten strongest equally for a month, and uses the index's 200-day moving average as a market gate. It includes commissions and excludes dividends and cash interest. We tested that strongest-ten teaching model, without the separate weakest-ten comparison or a trailing stop.
We interpret the lookback as 240 completed trading sessions, use a simple 200-close average and SPY as the tradable index proxy, then trade completed month-end decisions at the next actual regular-session opening. Those timing and proxy choices are explicit. The separate ASX article corroborates a completed monthly-close workflow; its top-five and 200-day ranking rules are not imported here.
All four matched native comparisons
Each book starts with $10,000, includes entry fees and ends at the October 6, 2026 close, 20:00 UTC. The first fills are January 3, 2022 at 14:30 UTC or January 2, 2025 at 14:30 UTC. Within each window, both books share the actual regular-session calendar and endpoint.
Worst losses use the complete session curve. The independently calculated Sharpe uses closing returns and differs from the stored native statistic.
Show the table · 4 rows, 6 columns
Scroll sideways to compare all columns. Select a heading to sort.
| 2022-01-03 | Strongest ten | 100.82% | 35.04% | 0.618 | $423.37 |
| 2022-01-03 | SPY hold | 68.93% | 26.15% | 0.744 | $9.85 |
| 2025-01-02 | Strongest ten | 58.01% | 35.04% | 0.819 | $159.21 |
| 2025-01-02 | SPY hold | 33.44% | 19.92% | 1.069 | $9.85 |
No matching rows. Clear the filter to see all records.
Cumulative returns after modeled fees; no estimate of intraday extremes. Recorded cash distributions are included in both books, an explicit extension of the price-only article.
The recent comparison
- Strongest ten 2026-10-06, 16:00:00 EDT
- 58.01
- SPY hold 2026-10-06, 16:00:00 EDT
- 33.44
Cumulative return (%)
Use the line buttons to compare the strategy with its recorded controls. Then switch to drawdown to inspect the losses behind the return.
- First recorded mark
- Jan 2, 2025 · 09:30:00 NY
- Last recorded mark
- Oct 6, 2026 · 16:00:00 NY
- Vertical axis range (percent)
- -16.84 to 83.36
The model finished at $15,801.42 versus SPY's $13,343.98. Its higher cumulative gain depended heavily on 2026: it earned only 7.73% in calendar 2025, versus SPY's 16.25%. The subsequent stock-basket decline produced a 35.04% drawdown versus 19.92% for SPY.
- Strongest ten 2026-10-06, 16:00:00 EDT
- -13.82
- SPY hold 2026-10-06, 16:00:00 EDT
- 0
Below the prior peak (%)
Choose the lines whose losses you want to compare. Hiding a line changes this view only; the recorded dates and chart scale stay fixed.
- First recorded mark
- Jan 2, 2025 · 09:30:00 NY
- Last recorded mark
- Oct 6, 2026 · 16:00:00 NY
- Vertical axis range (percent)
- -35.04 to 0.00
Zero is a prior high; -10 means 10% below that book’s prior peak. Compare losses over the same recorded window; these marks do not measure every intraday extreme.
The weaker years stay in the record
Holding the strongest stocks did not outperform every year. The model lagged sharply in 2023 and also lagged in 2025. Daily-close volatility in the 2022-start book was 32.31% annualized versus SPY's 16.75%; in the recent book it was 43.52% versus 16.72%. The larger upside required tolerating a much more volatile path.
Show the table · 5 rows, 3 columns
Scroll sideways to compare all columns. Select a heading to sort.
| 2022 | -7.30% | -18.57% |
| 2023 | +1.19% | +25.24% |
| 2024 | +34.09% | +23.88% |
| 2025 | +8.85% | +16.88% |
| 2026 through Oct 6 | +46.67% | +14.41% |
No matching rows. Clear the filter to see all records.
Calendar returns within the January 2022-start books. 2026 ends October 6; the recent-start book has different first-year entry and compounding history.
What was verified, and what remains limited
The saved native orders, fees, cash, quantities, paid entitlements and NAV were independently reconciled. Actual opening and closing quotes were checked; non-boundary marks can carry a prior verified quote as the native position does. The full tick drawdown matched the native maximum, avoiding the opening troughs that a sampled hourly history can miss.
Recorded model distributions total $206.75 in the 2022-start book and $73.57 in the recent book. SPY totals are $641.11 and $183.53. The model can redeploy that cash monthly; passive SPY holds it. The benchmark's issuer cash amounts and ex/pay days were independently checked. Complete issuer-payment coverage for every held stock is not certified, so these figures are audited recorded-input results, not source-perfect total-return replication.
Native price-anomaly warnings remain in the private audit; their cause and universal source completeness were not established.
A since-2014 comparison remains held on historical security and terminal-price coverage. It is not replaced by the favorable newer windows.
An editable historical portfolio needs its historical feed
The existing paper portfolio is inactive with manual approval, empty positions and separate cash. Its ordinary performance card has not earned these backtest results. Inspect it as a historical research snapshot. The full-book allocation and cash-exit behavior matter if the strategy is copied into an existing portfolio.
Its two custom inputs are bound to the captured historical ranking and date permissions. Rebuilding a generic strongest-ten ranking over current constituents would change the model. An ongoing version needs maintained point-in-time membership, complete prices, published monthly targets, fresh-date permissions and separately reviewed setup. Those future inputs are not installed by copying this expired snapshot.
Detailed measurement and provenance notes
Read the full accounting, source and execution assumptions
Worst losses use the complete audited native tick curve, including session opens and closes, with $10,000 as the initial high-water mark. Sharpe uses independent common session closing returns, a zero risk-free rate and 252-session annualization. It is distinct from the stored native headline Sharpe. No forced terminal sale is included.
Runtime evidence joins the actual claims to observed source/image configuration. It does not prove uninterrupted process/cache continuity or loaded-object hashes for every run.
No comments yet.