TL;DR
The BOLD-inspired Bitcoin/GLD blend returned 150.09% after modeled fees from April 2021 to October 6, 2026, versus 127.40% for monthly 50/50. Observed drawdown fell from 50.14% to 28.43%. Gold alone remained competitive and won the January 2025 start: 55.58% versus the blend's 42.72%. Inverse-volatility sizing reduced Bitcoin exposure but still suffered when both assets fell together. These overlapping historical tests measure NexusTrade's adaptation, not the original BOLD index or paper-account earnings.
- April 2021 start
- +150.09% after fees
- Matched monthly 50/50
- +127.40%
- Blend maximum drawdown
- 28.43%
- Recent gold-only return
- +55.58%
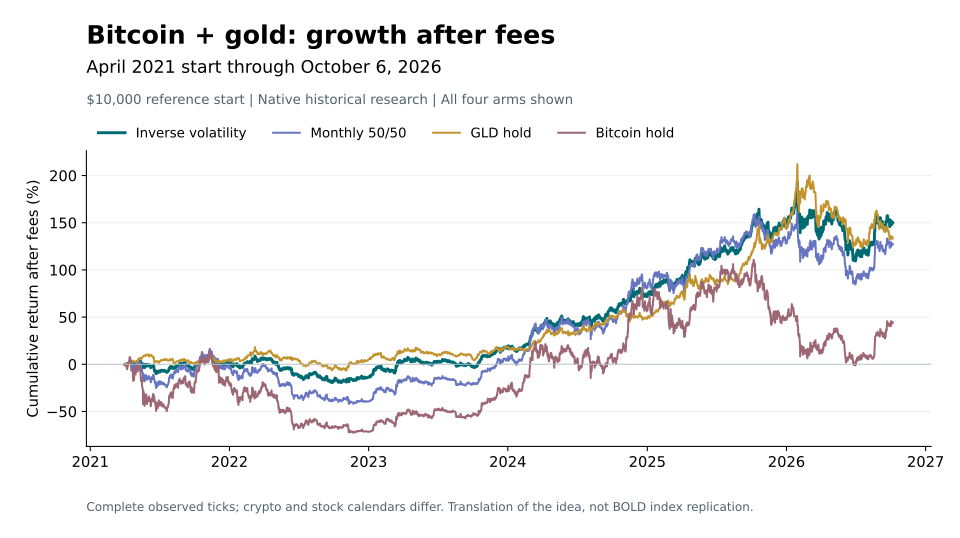
The broad comparison: April 2021 start
- Inverse volatility 2026-10-06, 16:00:00 EDT
- 150.09
- Monthly 50/50 2026-10-06, 16:00:00 EDT
- 127.4
- GLD hold 2026-10-06, 16:00:00 EDT
- 134.46
- Bitcoin hold 2026-10-06, 16:00:00 EDT
- 44.08
Cumulative return (%)
Use the line buttons to compare the strategy with its recorded controls. Then switch to drawdown to inspect the losses behind the return.
- First recorded mark
- Apr 1, 2021 · 09:30:00 NY
- Last recorded mark
- Oct 6, 2026 · 16:00:00 NY
- Vertical axis range (percent)
- -72.77 to 212.04
The blend finished at $25,008.98 versus $22,739.91 for monthly 50/50. Bitcoin alone finished at $14,407.72 after its modeled entry fee. Gold finished at $23,446.41. The blend's return advantage over gold was much smaller than its advantage over Bitcoin, and its worst drawdown was slightly larger than gold's.
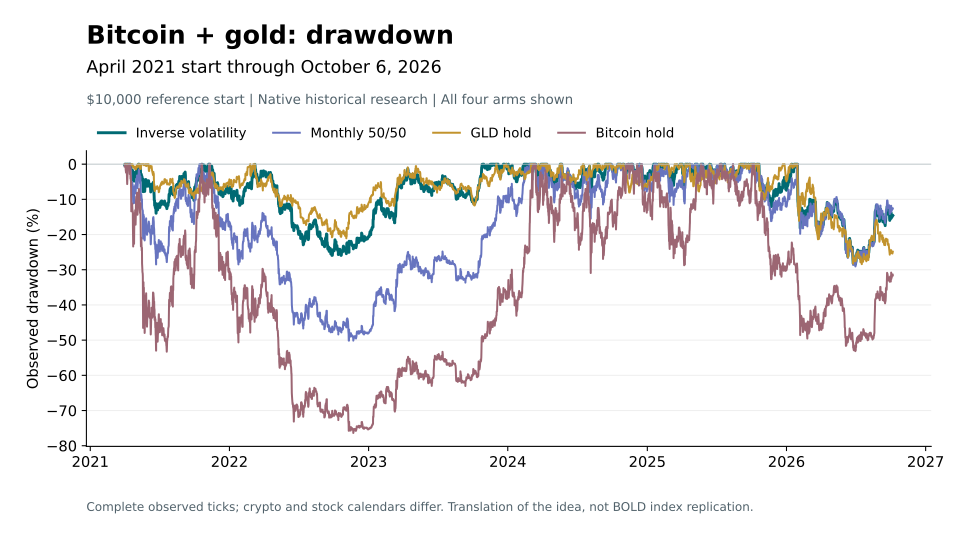
- Inverse volatility 2026-10-06, 16:00:00 EDT
- -14.54
- Monthly 50/50 2026-10-06, 16:00:00 EDT
- -12.59
- GLD hold 2026-10-06, 16:00:00 EDT
- -24.86
- Bitcoin hold 2026-10-06, 16:00:00 EDT
- -31.62
Below the prior peak (%)
Choose the lines whose losses you want to compare. Hiding a line changes this view only; the recorded dates and chart scale stay fixed.
- First recorded mark
- Apr 1, 2021 · 09:30:00 NY
- Last recorded mark
- Oct 6, 2026 · 16:00:00 NY
- Vertical axis range (percent)
- -76.38 to 0.00
Zero is a prior high; -10 means 10% below that book’s prior peak. Compare losses over the same recorded window; these marks do not measure every intraday extreme.
What did Bitcoin/gold risk sizing change?
Charlie Morris's BOLD idea combines Bitcoin and gold, then gives more weight to the less volatile asset. We translated that idea into a NexusTrade strategy using BTC-USD and the GLD gold ETF. From April 1, 2021 through October 6, 2026, it returned 150.09% after modeled fees, versus 127.40% for a monthly 50/50 blend. Maximum observed drawdown fell from 50.14% to 28.43%.
The simpler gold holding remains a serious alternative. GLD returned 134.46% over that broad window with a slightly smaller 28.41% drawdown. From January 2, 2025, it returned 55.58%, ahead of the blend's 42.72%, with a higher native Sharpe ratio. The case for the blend is diversified Bitcoin exposure with much less damage than holding Bitcoin alone across these dates.
These are twelve completed historical backtests across three overlapping windows. They measure our implementation of the source idea. The editable paper portfolio is separate, and its empty account has not earned these returns. Morris has not endorsed this implementation.
Where the protection failed
The broad-start blend lost 14.79% in calendar 2022. Monthly 50/50 lost 36.68% and Bitcoin lost 63.25%; GLD lost only 0.76%. The blend then gained 35.89% in 2023 and 47.09% in 2024, while Bitcoin gained 152.53% and 118.40%. Its defensive allocation gave up much of those Bitcoin rallies.
Its worst observed drawdown came later, from the January 29, 2026 opening to the June 30 closing. In the recent-start book, value fell from $16,699.94 to $11,951.98. Bitcoin contributed a $1,730.41 marked loss, GLD a $2,988.60 loss, and fees another $28.95. Both assets fell together. Inverse-volatility sizing did not cap that 28.43% loss.
Actual broad-window monthly Bitcoin targets ranged from 15.49% to 40.83%. Those are observed outcomes of the frozen rule, not a chosen allocation band or a guarantee about future weights.
All twelve comparisons
Show the table · 12 rows, 6 columns
Scroll sideways to compare all columns. Select a heading to sort.
| 2021-04-01 | Inverse volatility | 150.09% | 28.43% | 0.972 | $223.03 |
| 2021-04-01 | Monthly 50/50 | 127.40% | 50.14% | 0.652 | $261.92 |
| 2021-04-01 | Bitcoin hold | 44.08% | 76.38% | 0.399 | $68.95 |
| 2021-04-01 | GLD hold | 134.46% | 28.41% | 0.969 | $9.85 |
| 2022-01-03 | Inverse volatility | 148.19% | 28.43% | 1.095 | $200.70 |
| 2022-01-03 | Monthly 50/50 | 135.50% | 42.13% | 0.785 | $241.64 |
| 2022-01-03 | Bitcoin hold | 79.77% | 66.52% | 0.495 | $68.95 |
| 2022-01-03 | GLD hold | 124.39% | 28.40% | 1.022 | $9.85 |
| 2025-01-02 | Inverse volatility | 42.72% | 28.43% | 0.815 | $85.77 |
| 2025-01-02 | Monthly 50/50 | 22.65% | 29.06% | 0.412 | $94.88 |
| 2025-01-02 | Bitcoin hold | -11.60% | 52.99% | -0.052 | $68.95 |
| 2025-01-02 | GLD hold | 55.58% | 28.34% | 0.997 | $9.85 |
No matching rows. Clear the filter to see all records.
Cumulative net returns, not annualized. Drawdown uses the complete measured Market/history union. Native Sharpe uses arm-specific observed tick frequency and the stored annual risk-free percentage; its economic origin was not independently traced, so treat it as a supplemental native statistic.
Each run starts with $10,000 and includes modeled entry fees. The endpoints within each window match exactly: April 1, 2021 at 13:30 UTC; January 3, 2022 at 14:30 UTC; or January 2, 2025 at 14:30 UTC, through October 6, 2026 at 20:00 UTC. Those openings are 09:30 New York time; the ending mark is 16:00 New York time.
The January 2022-start result includes almost five years, not just the calendar-year 2022 crash. All windows are retrospective development evidence. Their overlap does not create three independent out-of-sample tests.
The published idea and our implementation
Morris describes BOLD as a monthly Bitcoin/gold allocation based on past 360-day volatility. Each asset's target is proportional to one divided by its volatility. With two assets, the Bitcoin weight is (1 / Bitcoin volatility) divided by the sum of both inverse volatilities. Equal volatility gives equal weights.
The March 2021 index methodology uses physical gold and London reference prices, a five-business-day data cutoff, and the last business day of the SIX exchange calendar. The April 2021 whitepaper describes second-Wednesday rebalancing using the previous day's volatility. These are distinct source calendars. Later index-calendar revisions also exist; the backtest does not claim to reproduce an original or current BOLD index.
Show the table · 8 rows, 2 columns
| Choice | Native research implementation |
|---|---|
| Assets | BTC-USD spot cryptocurrency and GLD, an ETF proxy for physical gold |
| Volatility | Population standard deviation of native one-day percent rate-of-change values over a 360-day timestamp window, with day-bucket replacement and thinning |
| Rate of change | Newest price versus the oldest retained timestamp in the one-day window; not automatically a completed daily-close return |
| Target weights | Per-asset 1 / volatility, normalized across the two assets; archived raw and normalized weights were checked |
| Monthly clock | First eligible New York stock-session opening at 09:30 in days 1 through 7, more than seven native days since the strategy fired |
| Admission | Positive prices and finite positive volatilities, reciprocals and reciprocal sum; positive Price alone does not prove source freshness |
| Sizing | 98.5% of pre-fee native portfolio value, with a 1.5% reserve; fractional units; actual fees deducted from cash |
| Costs | 0.7% per Bitcoin fill and 0.1% per stock/GLD fill; no cash interest, leverage, shorting or forced final sale |
No matching rows. Clear the filter to see all records.
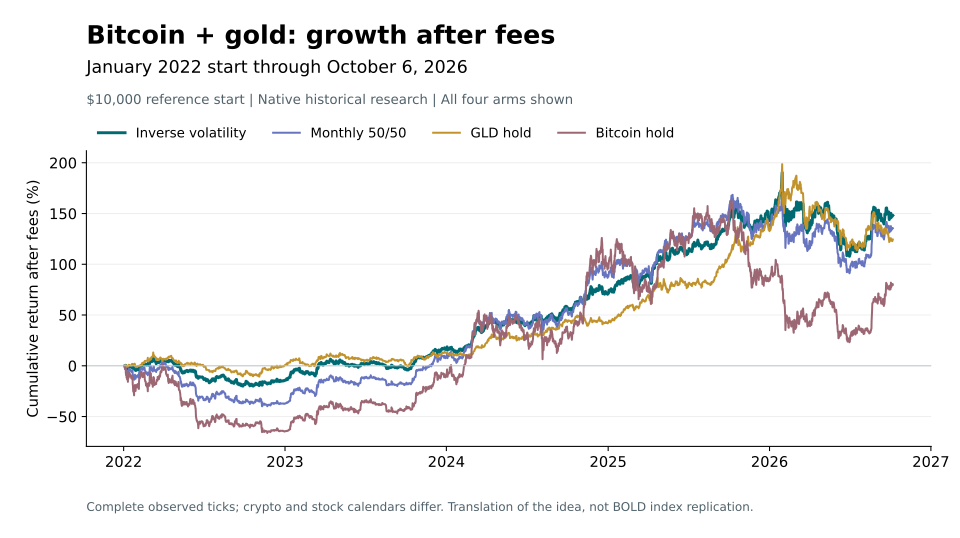
Starting before the 2022 decline
- Inverse volatility 2026-10-06, 16:00:00 EDT
- 148.19
- Monthly 50/50 2026-10-06, 16:00:00 EDT
- 135.5
- GLD hold 2026-10-06, 16:00:00 EDT
- 124.39
- Bitcoin hold 2026-10-06, 16:00:00 EDT
- 79.77
Cumulative return (%)
Use the line buttons to compare the strategy with its recorded controls. Then switch to drawdown to inspect the losses behind the return.
- First recorded mark
- Jan 3, 2022 · 09:30:00 NY
- Last recorded mark
- Oct 6, 2026 · 16:00:00 NY
- Vertical axis range (percent)
- -66.18 to 198.61
From January 3, 2022 through October 6, 2026, the blend returned 148.19%, versus 135.50% for monthly 50/50 and 79.77% for Bitcoin hold. It still lost money during calendar 2022. Its lower Bitcoin allocation reduced the damage; it did not avoid it.
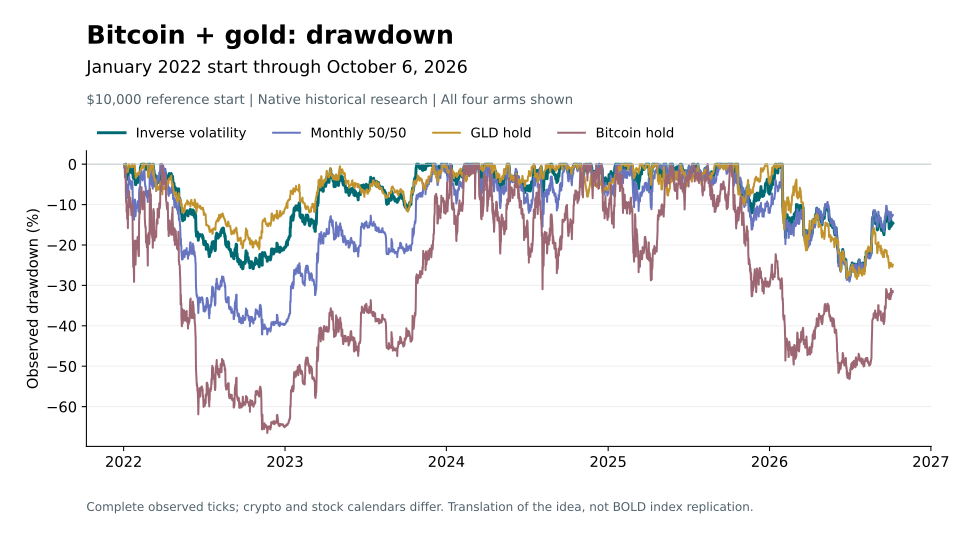
- Inverse volatility 2026-10-06, 16:00:00 EDT
- -14.54
- Monthly 50/50 2026-10-06, 16:00:00 EDT
- -12.59
- GLD hold 2026-10-06, 16:00:00 EDT
- -24.86
- Bitcoin hold 2026-10-06, 16:00:00 EDT
- -31.65
Below the prior peak (%)
Choose the lines whose losses you want to compare. Hiding a line changes this view only; the recorded dates and chart scale stay fixed.
- First recorded mark
- Jan 3, 2022 · 09:30:00 NY
- Last recorded mark
- Oct 6, 2026 · 16:00:00 NY
- Vertical axis range (percent)
- -66.52 to 0.00
Zero is a prior high; -10 means 10% below that book’s prior peak. Compare losses over the same recorded window; these marks do not measure every intraday extreme.
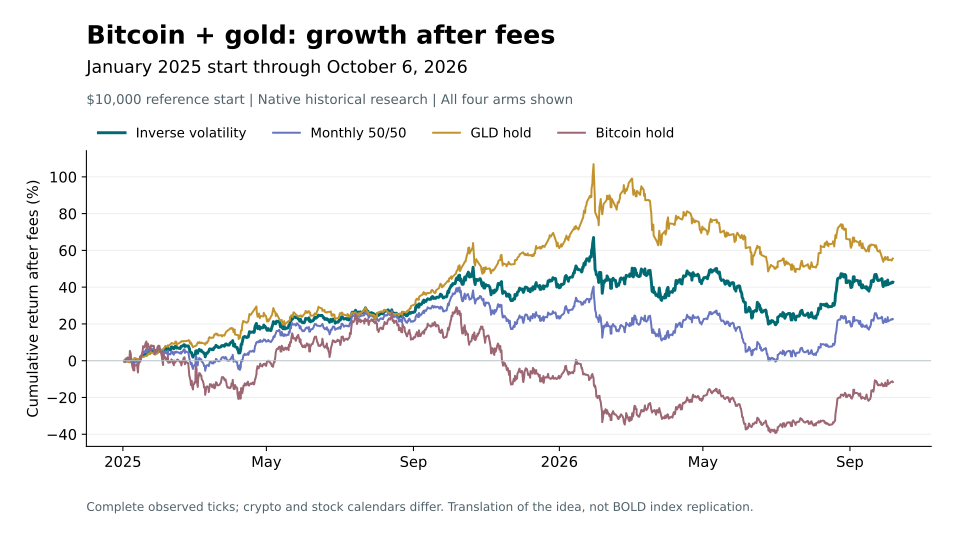
The recent comparison: gold wins
- Inverse volatility 2026-10-06, 16:00:00 EDT
- 42.72
- Monthly 50/50 2026-10-06, 16:00:00 EDT
- 22.65
- GLD hold 2026-10-06, 16:00:00 EDT
- 55.58
- Bitcoin hold 2026-10-06, 16:00:00 EDT
- -11.6
Cumulative return (%)
Use the line buttons to compare the strategy with its recorded controls. Then switch to drawdown to inspect the losses behind the return.
- First recorded mark
- Jan 2, 2025 · 09:30:00 NY
- Last recorded mark
- Oct 6, 2026 · 16:00:00 NY
- Vertical axis range (percent)
- -39.30 to 106.90
From January 2, 2025, GLD returned 55.58%, versus the blend's 42.72%, monthly 50/50's 22.65% and Bitcoin's -11.60%. The blend's recent marked sleeve gains were $4,358.13 from GLD and about two cents from Bitcoin, before $85.77 of trading fees. Holding less gold during its rally explains the missed upside.
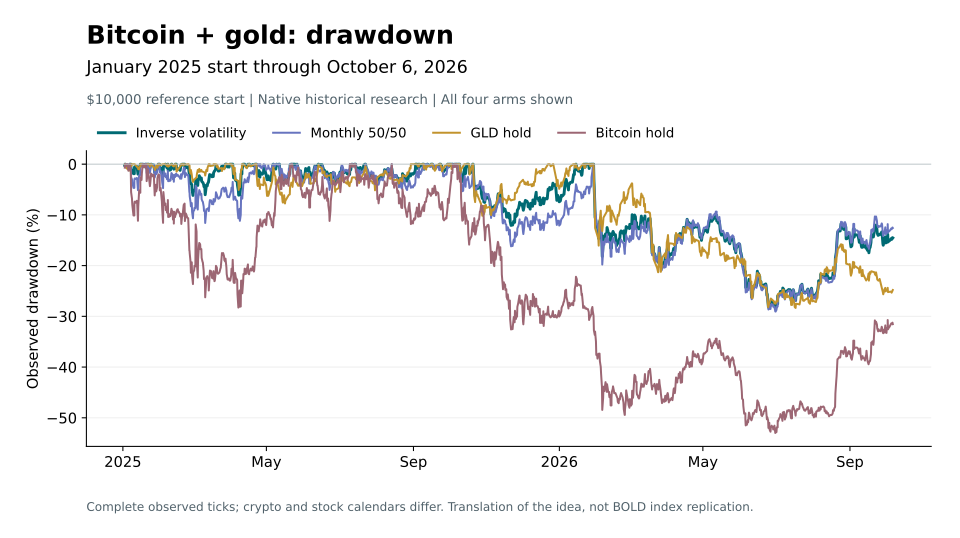
- Inverse volatility 2026-10-06, 16:00:00 EDT
- -14.54
- Monthly 50/50 2026-10-06, 16:00:00 EDT
- -12.59
- GLD hold 2026-10-06, 16:00:00 EDT
- -24.8
- Bitcoin hold 2026-10-06, 16:00:00 EDT
- -31.54
Below the prior peak (%)
Choose the lines whose losses you want to compare. Hiding a line changes this view only; the recorded dates and chart scale stay fixed.
- First recorded mark
- Jan 2, 2025 · 09:30:00 NY
- Last recorded mark
- Oct 6, 2026 · 16:00:00 NY
- Vertical axis range (percent)
- -52.99 to 0.00
Zero is a prior high; -10 means 10% below that book’s prior peak. Compare losses over the same recorded window; these marks do not measure every intraday extreme.
What the audit established
Saved orders, cash, quantities, fees, portfolio marks and monthly target weights were reconciled. The financial consumer combined recorded Market ticks with history-only valuations, then reproduced all twelve native return and drawdown statistics. Checking the union matters: an hourly history chart can omit a market extreme, and some crypto halfday close marks appear only in history.
Bitcoin trades around the clock while GLD follows exchange sessions. GLD-only runs also contain a few economic-data ticks on closed days with the preceding verified price carried forward and no orders. A common volatility annualization does not establish equal calendar-risk contributions when the underlying samples differ.
Use those dates when comparing the corrected historical results.
Inspect the strategy before using it
The graph uses built-in indicators and an explicit two-asset universe. It is editable, inactive and requires manual order approval. It should be inspected in a separate paper portfolio: its allocation action sizes the full book, so copying it into an existing mixed portfolio changes the scope of the rebalance.
GLD market prices include its ETF structure and embedded expenses. Native BTC-USD prices differ from the earlier Binance BTC/USDT research, which also used different candle and funding clocks. Only the native figures appear on this page. Future feed freshness, broker execution, spread and market impact have not been certified by these historical checks.
They omit private account identifiers and the full authenticated signal/order tapes. They support inspection of the reported measurements, rather than independent reproduction from every original provider row.
Detailed measurement and provenance notes
Read the full accounting, source and execution assumptions
The research used reviewed earlier and newer engine versions with reconciled shared inputs and relevant source behavior. It did not collect a fresh loaded-binary checksum for every run. Data recovery was verified before the corrected research.
No comments yet.