TL;DR
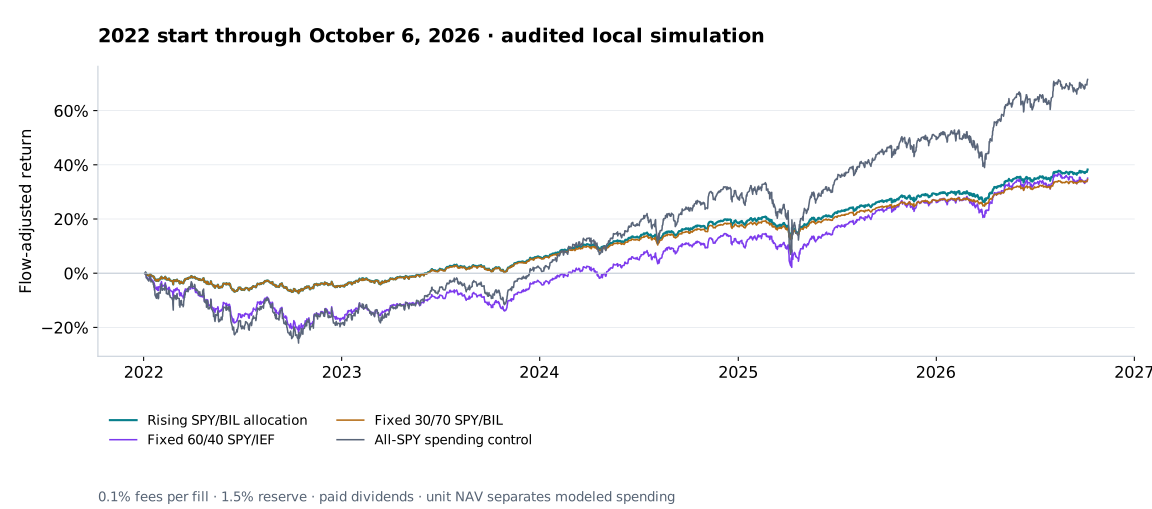
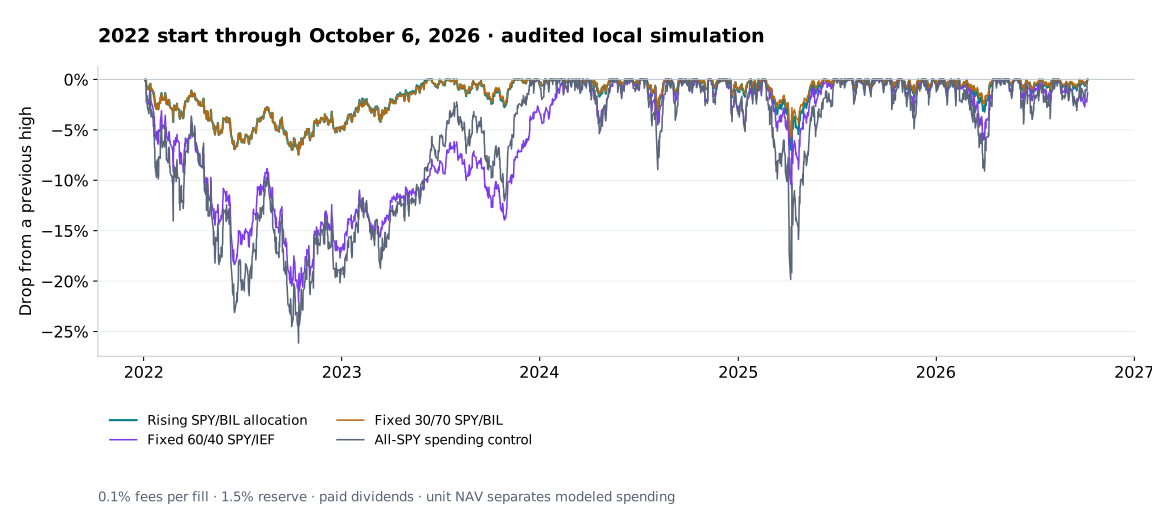
In the selected January 2022 to October 6, 2026 retirement simulation, rising SPY/BIL funded $2,190.81 of spending and left $11,046.50, versus $10,609.17 for matched 60/40. Market drawdown excluding withdrawals was 7.46% versus 22.10%. The 2020 and 2025 starts left less capital than 60/40, and fixed 30/70 stocks/bills matched the rising path's worst losses. Lower equity and bills explain much of the protection. The editable portfolio automates allocation only, not spending or retirement accounting.
- Selected 2022 market drop
- 7.46% vs 22.10% for 60/40
- Equal modeled spending
- $2,190.81 each
- Selected remaining capital
- $11,046.50 vs $10,609.17
- Editable portfolio
- Allocation only · historical snapshot
The selected 2022 comparison
Show the table · 4 rows, 6 columns
Scroll sideways to compare all columns. Select a heading to sort.
| Rising SPY/BIL | 38.25% | 7.46% | 1.258 | $11,046.50 | $2,190.81 |
| Fixed 60/40 SPY/IEF | 35.08% | 22.10% | 0.638 | $10,609.17 | $2,190.81 |
| Fixed 30/70 SPY/BIL | 34.59% | 7.46% | 1.270 | $10,737.18 | $2,190.81 |
| All-SPY spending control | 71.50% | 26.15% | 0.755 | $13,678.47 | $2,190.81 |
No matching rows. Clear the filter to see all records.
Separate $10,000 starts on January 3, 2022. Flow-adjusted unit NAV removes external withdrawals from investment returns and drawdown; remaining capital includes their effect.
A retirement-risk result, with spending modeled separately
In the selected January 3, 2022 to October 6, 2026 simulation, rising equity with Treasury-bill ETF ballast funded $2,190.81 of withdrawals and left $11,046.50. The matched 60/40 SPY/IEF control funded the same withdrawals and left $10,609.17. The market drop measured independently of spending was 7.46% versus 22.10%.
Michael Kitces's August 2014 article describes research with Wade Pfau on starting retirement with lower equity exposure, then raising it. We translated its accelerated stock-and-bills allocation into SPY/BIL. The source objective is sequence-risk management and sustainable spending, rather than maximum terminal wealth.
The 2022 start was selected after reviewing all three windows because it illustrates that risk question. The 2020 and 2025 starts left less capital than 60/40. Fixed 30/70 stocks/bills had the same maximum market drops and slightly higher Sharpe in every window. That control shows that lower equity exposure and bills explain much of the protection; these results do not isolate glidepath superiority.
Broad and recent starts keep the growth sacrifice visible
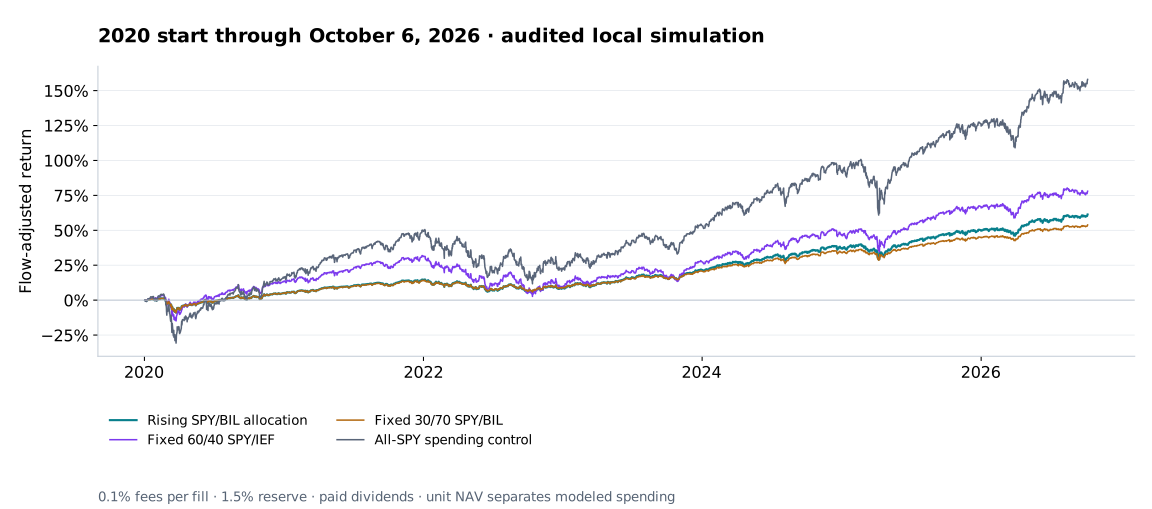
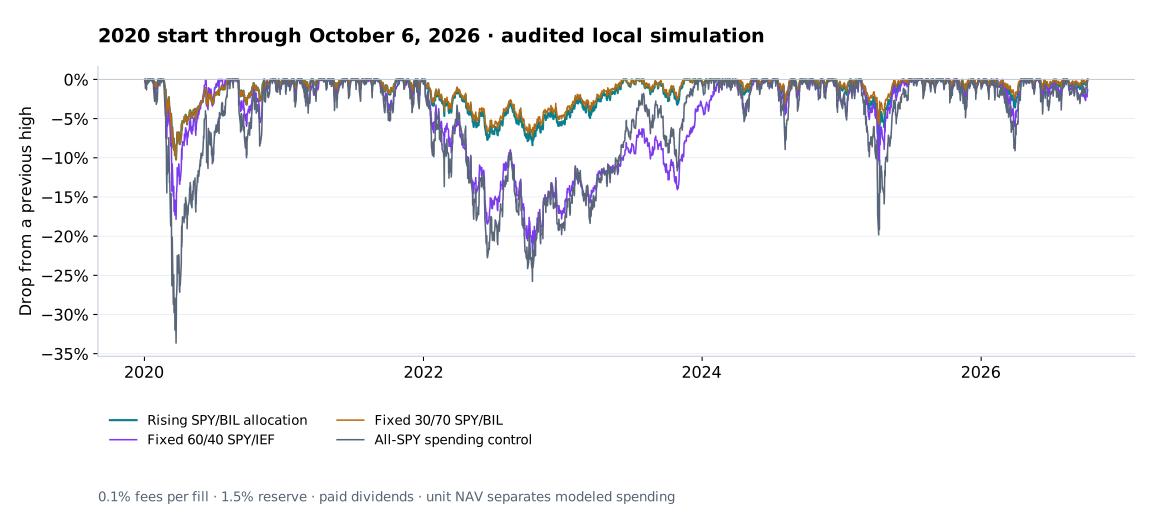
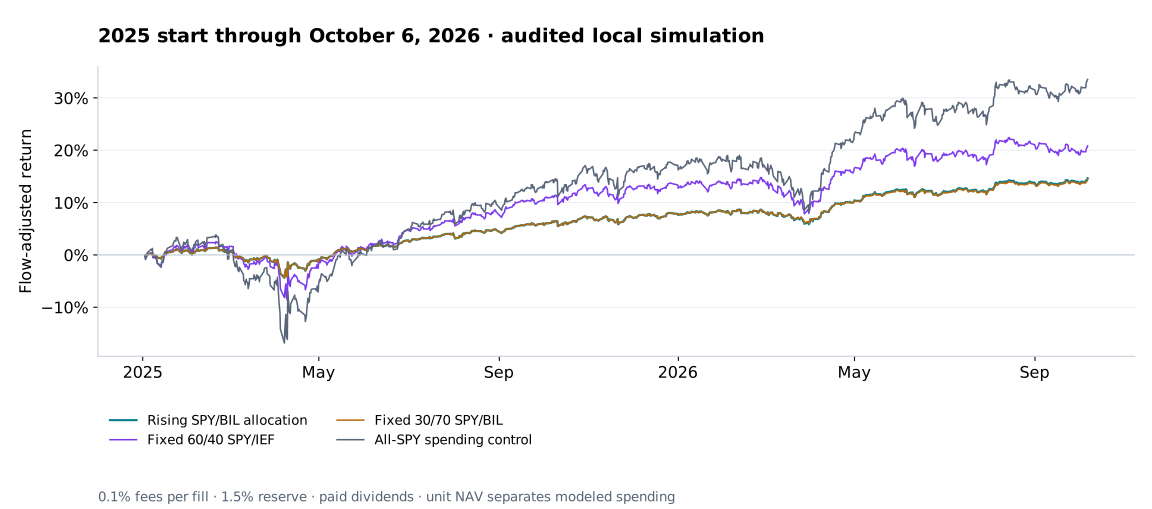
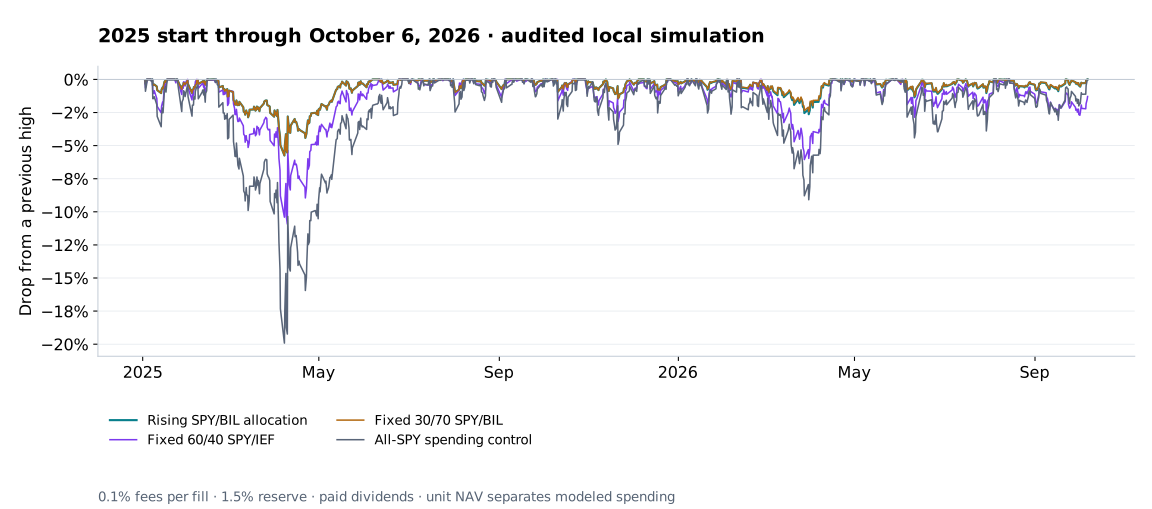
For the January 2020 start, rising equity left $11,818.99 versus $13,316.87 for 60/40 after equal $3,172.16 withdrawals. Its market drop was 10.22% versus 22.18%, and its daily-close Sharpe was 1.132 versus 0.798. Starting January 2025, it left $10,570.09 versus $11,161.17 after equal $810.94 withdrawals, with a 5.75% versus 10.92% market drop.
Rising equity left more capital than fixed 30/70 bills in all three windows, but the fixed-bills control had slightly higher Sharpe and exactly the same maximum drop. All-SPY left the most capital in every window, with deeper drops. Every observed withdrawal was funded; a maximum 6.76-year replay cannot establish thirty-year retirement survival or a safe withdrawal rate.
Show the table · 8 rows, 7 columns
Scroll sideways to compare all columns. Select a heading to sort.
| 2020-01-02 | Rising SPY/BIL | 61.32% | 10.22% | 1.132 | $11,818.99 | $3,172.16 |
| 2020-01-02 | Fixed 60/40 SPY/IEF | 77.97% | 22.18% | 0.798 | $13,316.87 | $3,172.16 |
| 2020-01-02 | Fixed 30/70 SPY/BIL | 53.83% | 10.22% | 1.155 | $11,233.83 | $3,172.16 |
| 2020-01-02 | All-SPY | 158.00% | 33.65% | 0.814 | $20,120.33 | $3,172.16 |
| 2025-01-02 | Rising SPY/BIL | 14.66% | 5.75% | 1.589 | $10,570.09 | $810.94 |
| 2025-01-02 | Fixed 60/40 SPY/IEF | 20.83% | 10.92% | 1.115 | $11,161.17 | $810.94 |
| 2025-01-02 | Fixed 30/70 SPY/BIL | 14.41% | 5.75% | 1.591 | $10,547.19 | $810.94 |
| 2025-01-02 | All-SPY | 33.52% | 19.92% | 1.070 | $12,348.82 | $810.94 |
No matching rows. Clear the filter to see all records.
All end October 6, 2026. Returns and market drops are flow adjusted. Each window restarts the same 4% initial real-spending rule and the 30% starting equity weight.
The source allocation and the ETF translation

Show the table · 5 rows, 2 columns
| Source rule or objective | Implementation in this study |
|---|---|
| Begin with 30% stocks, 70% bills | SPY / BIL ETF proxies |
| Raise stocks by two percentage points per year | First actual January opening; cap at 60% |
| Study retirement spending and sequence risk | Same 4% initial real withdrawal for each matched book |
| Compare Treasury-bond ballast | IEF seven-to-ten-year ETF proxy, not a constant-maturity ten-year note |
| Rolling thirty-year source horizons | Only the actual 2020, 2022 and 2025 starts available here |
No matching rows. Clear the filter to see all records.
The source compares accelerated rising equity with conventional stock/bond retirement portfolios and considers Treasury bills as ballast. Our proxies, January clock, fees and withdrawal timing are disclosed translations. We did not change the source weight path after inspecting performance.
Annual spending starts at $400 from each $10,000 book and grows with the prior November CPI. The local model uses cash first, then proportional fee-grossed sales if necessary, followed by the annual allocation reset. That causal order and CPI month are our choices. Current-vintage CPI matched the retained official release archives; original first-vintage files are not claimed.
Where the 2022 protection came from
In the 2022-start books' first calendar year, rising stocks/bills lost 4.70% in flow-adjusted return versus 16.94% for 60/40 SPY/IEF. The smaller starting stock allocation and short bill duration reduced the joint stock-and-bond loss. Fixed 30/70 bills had the same maximum drawdown because it shared those early weights; the rising path increased equity only at later annual resets.
The annual withdrawals were funded at actual opening prices before rebalancing. Cash dividends accumulated between resets. The saved ledgers distinguish sales that fund spending from sales that change allocation, so a withdrawal cannot be mistaken for a market loss or trading gain.
The same path sacrificed remaining capital against 60/40 in the broad and recent books. This is the source's risk-versus-upside trade-off, not evidence that every retirement start benefits. We preserved all four controls and ran no tuned allocation or withdrawal variant.
The editable portfolio automates allocation only
Inspect the request
The separately created inactive paper snapshot contains five historical January openings: 2022-01-03, 2023-01-03, 2024-01-02, 2025-01-02 and 2026-01-02 at 09:30 New York. Its SPY targets are 30%, 32%, 34%, 36% and 38%, with complementary BIL weights before the 1.5% reserve. These dates are expired, so the finite snapshot cannot place future orders without editing.
It begins empty with $10,000, fractional shares, cash dividends and manual approval. Its full-book allocation action can resize the dedicated book; it is not a sleeve inside an unrelated account. The CPI withdrawals, funding sales and flow-adjusted retirement accounting shown in the charts are separate local research and are not automated by this portfolio.
Positive price guards do not prove quote freshness. A historical schedule does not establish a continuing feed, current pilot, native financial parity or forward fills. The research notes retain all twelve comparisons. Attribution to Kitces and Pfau does not imply their participation, endorsement or an approved managed retirement product.
Cash, costs and the audit boundary
Read the full measurement assumptions
All books use actual matched daily openings and closings, 0.1% fees per fill, a 1.5% reserve and fractional shares. Dividend entitlement uses pre-ex ownership, and each payment becomes cash at the first observed tick at or after the stored payable timestamp. Cash is retained, with no DRIP. Free cash earns no interest. No taxes, borrowing or extra spread estimate are included; fund expenses are reflected in traded prices.
Civil-date storage at 16:00 New York is not proof of intraday issuer availability. A half-day payment can be credited at the next observed opening. A separate peer reconstructed all twelve saved books' CPI spending, funding fills, units, cash, quantities, fees, paid dividends and NAV, with over one million saved-artifact checks.
Market drawdown and return use unit NAV after canceling units for external withdrawals. Remaining capital separately includes spending. Sharpe uses daily-close unit returns, sample standard deviation, 252 periods and a zero risk-free rate. Every saved open/close mark is retained; there is no intraday-extrema or native-engine claim. The longest window is 6.76 years, with a partial 2026 end, rather than a thirty-year safe-withdrawal test.
No comments yet.