What did the smoother path cost in growth?
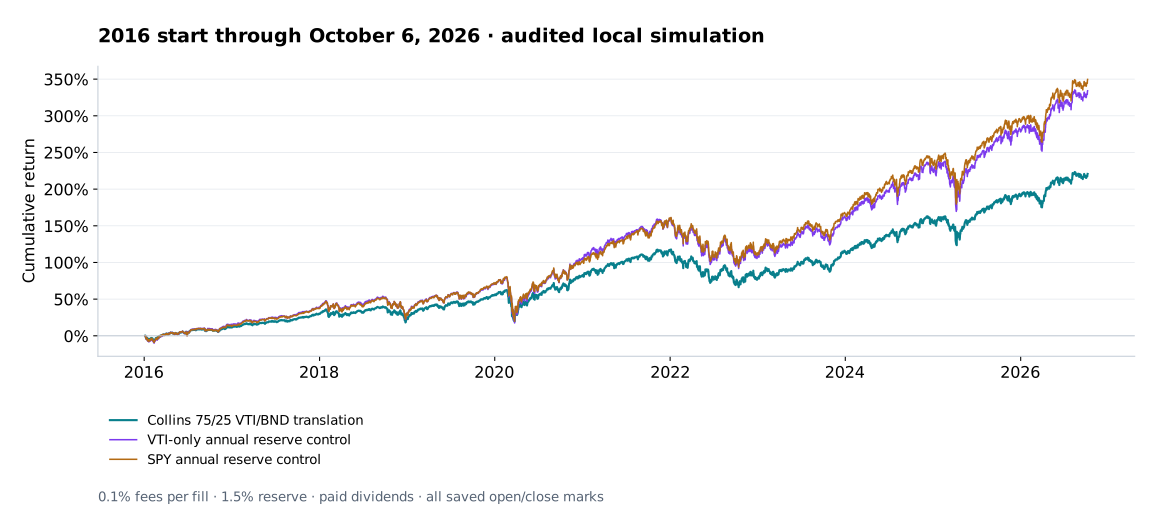
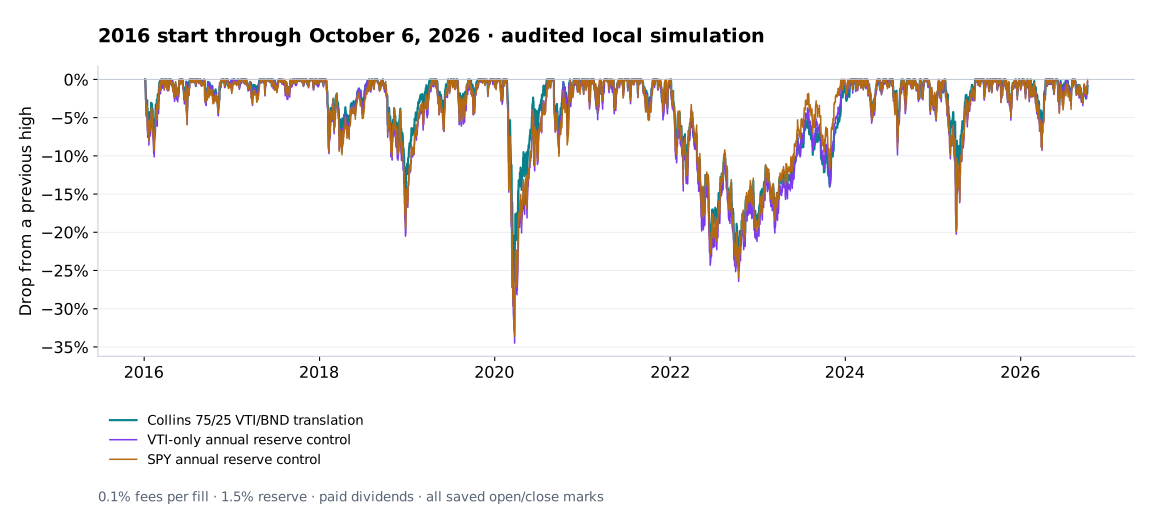
The 75% VTI / 25% BND translation grew $10,000 to $32,073 from January 4, 2016 through October 6, 2026. Its worst observed drop was 26.42%, against 34.50% for the matched VTI-only control. VTI alone ended at $43,409. The preservation allocation reduced the largest drop while leaving substantially less capital.
JL Collins's historical preservation example adds a bond allocation to a total-US-stock portfolio. The point is a smoother path while preserving growth. This study uses the ETF equivalents he names, rather than substituting SPY for his total-market fund. It studies a specific published example, not his complete current holdings or a creator-endorsed product.
Scroll sideways to compare all columns. Select a heading to sort.
| 75/25 VTI/BND translation | 220.73% | 26.42% | 0.876 |
| VTI-only annual reserve control | 334.09% | 34.50% | 0.858 |
| SPY annual reserve control | 349.60% | 33.62% | 0.889 |
No matching rows. Clear the filter to see all records.
January 4, 2016 to October 6, 2026. Cumulative net returns. All three books start with $10,000 and use the same annual reserve and dividend policy.
Broad returns and drops from previous highs
The recent benefit and the smaller 2022 cushion
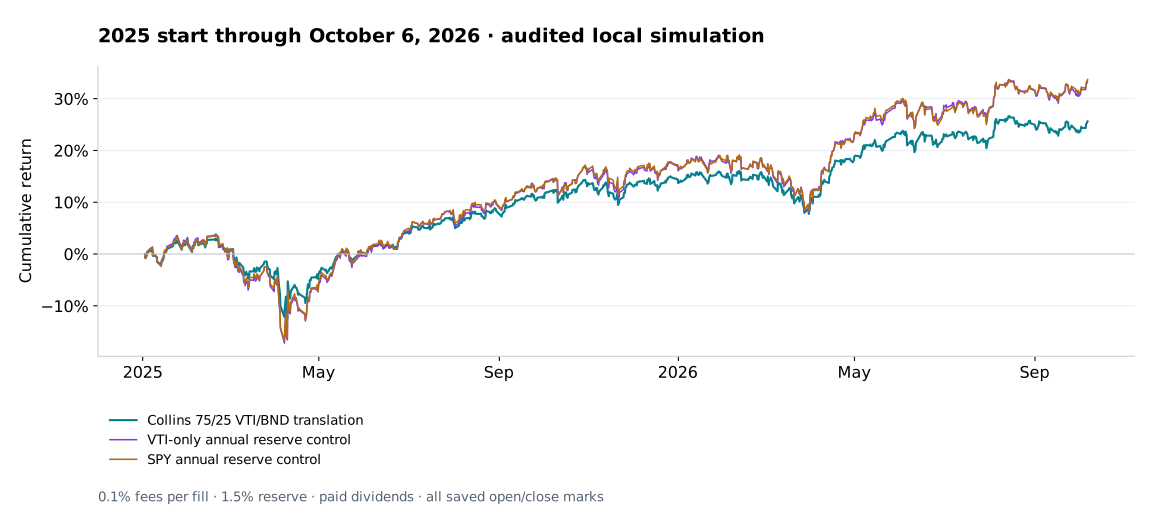
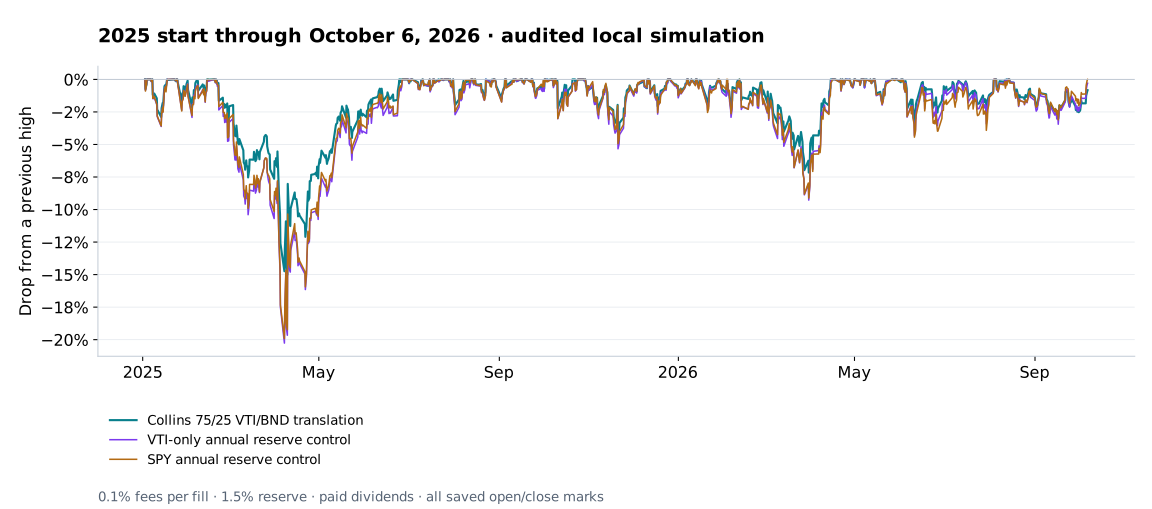
Starting January 2, 2025, the allocation returned 25.61% with a 15.01% drop, versus VTI's 33.32% and 20.26%. Its daily-close Sharpe was slightly higher, 1.084 versus 1.059. That is a risk trade-off with lower growth, rather than a return win.
The 2022 start had a smaller benefit: 23.65% maximum drop against VTI's 26.44%. Its Sharpe was lower, 0.679 versus 0.710, and its cumulative return was 47.56% against 67.23%. Bonds offered limited help when stocks and bonds fell together.
Scroll sideways to compare all columns. Select a heading to sort.
| 2022-01-03 | 75/25 VTI/BND | 47.56% | 23.65% | 0.679 |
| 2022-01-03 | VTI-only control | 67.23% | 26.44% | 0.710 |
| 2022-01-03 | SPY control | 72.21% | 26.24% | 0.757 |
| 2025-01-02 | 75/25 VTI/BND | 25.61% | 15.01% | 1.084 |
| 2025-01-02 | VTI-only control | 33.32% | 20.26% | 1.059 |
| 2025-01-02 | SPY control | 33.71% | 19.92% | 1.073 |
No matching rows. Clear the filter to see all records.
Separate initializations ending October 6, 2026. The controls rebalance their reserve annually and reinvest paid cash; they are not frictionless index returns.
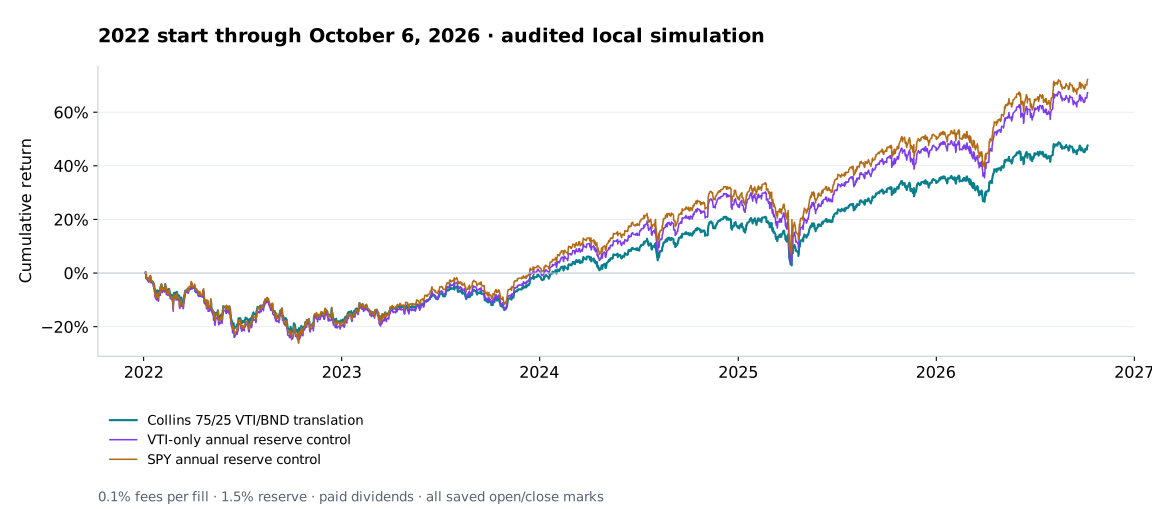
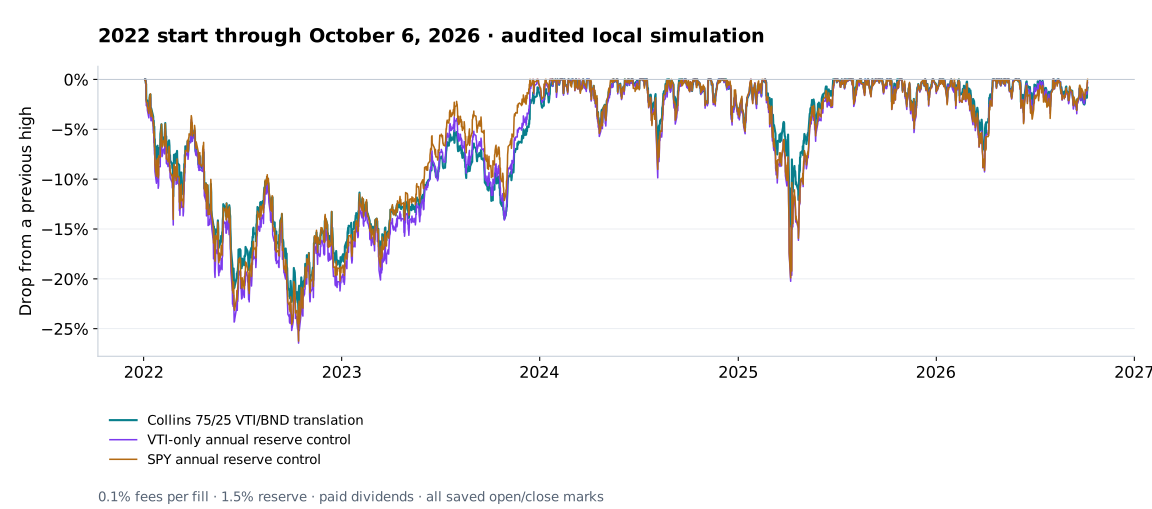
The source allocation and our execution choices
The Smoother Path to Wealth supplies the historical 75/25 allocation and annual birthday-rebalance idea. Collins's ETF discussion supplies VTI and BND. January timing and the trading reserve are our implementation choices. The 2016 start is retrospective context using the later published ETF mapping, not a claim that this exact ETF setup was prescribed at that date.
His 2026 writing adds international investing context. We preserve the historical preservation example instead of presenting it as his complete current portfolio. No allocation, timing or asset was tuned after examining these nine books.
Scroll sideways to compare all columns. Select a heading to sort.
| 75% total-US stocks / 25% total-US bonds | VTI / BND ETF equivalents |
| Approximately annual rebalancing, often on a birthday | First regular January opening |
| Separate cash for upcoming expenses | Not modeled; 1.5% trading reserve is a separate implementation choice |
| Wealth preservation with continued growth | No withdrawals, new savings or taxes modeled |
No matching rows. Clear the filter to see all records.
The losses behind the risk comparison
At the broad portfolio's peak on February 19, 2020 and trough at the March 23 opening, VTI's marked position value fell about $4,108 and BND's about $184. Bonds reduced the book's equity exposure, but were not immune to that selloff. The recorded portfolio fell 26.42% from its previous high.
The continuing broad book lost 17.62% in calendar 2022, against 19.23% for VTI alone. That narrow cushion helps explain why the separately initialized 2022 allocation had worse Sharpe than the equity controls. In the recent peak-to-trough episode, February 19 to April 9, 2025, VTI contributed roughly $1,531 of marked decline and BND roughly $14.
Annual resets repeatedly sold some appreciated VTI to replenish BND, and sometimes did the reverse after weaker equities. Those are the fixed allocation's actual rebalance legs. We retained the growth sacrifice and the stock-and-bond losing years instead of introducing a guessed trend filter.
Cash dividends, fees and what was audited
Read the accounting and data assumptions
All nine books use actual daily openings and closings, $10,000 initial capital, fractional shares, 0.1% fees per fill and a 1.5% reserve. Paid dividends are reinvested only into the ETF that paid them, after deducting the reinvestment fee. Entitlement locks pre-ex-date holdings; no future payable entitlement is included in terminal NAV. Free cash earns zero interest. Fund expenses are already reflected in traded prices; taxes, extra spread, deposits and withdrawals are excluded.
A missing VTI December 2025 payment was explicitly restored from Vanguard's issuer table for the original local study. The later canonical repair and independent afterimage proof confirm that same real payment. This preserves the original study's local correction provenance instead of calling it a native result. On the December 24 half-day, its stored 16:00 New York payable timestamp falls after the last observed close; our first-observed-tick convention credits and reinvests it at the December 26 opening.
A separate saved-ledger peer reconciled actual prices, pre-ex ownership, paid cash, reinvestment fees, quantities and NAV. Maximum drop includes the initial $10,000 peak and every saved opening/closing mark. Sharpe uses daily-close returns, 252 periods and a zero risk-free rate. Neither measure claims intraday extrema. The windows are inspected historical research, not unseen validation.
Editable allocation, with dedicated-book boundaries
The separately created paper setup is inactive, empty and uses manual approval. Its annual rebalance targets the full book. Adding it to a mixed account can sell eligible holdings outside VTI/BND and resize the existing positions; it does not ring-fence a separate sleeve. A dedicated new book is the clearest way to inspect the 75/25 example.
The January rule uses a same-strategy cooldown. A late-December initialization can postpone the immediate January reset, so review the chosen birthday and initial funding before activation. Paid-dividend reinvestment follows the supported product rule, but this report's nine local books are not a native backtest or proof of future paper fills. Copy setup, approval and trading remain separate decisions.
This is NexusTrade's independent implementation of a published preservation idea, without Collins's participation or endorsement. It is not his complete personal holdings, an expenses account, a managed subscription or a promise of ongoing performance.
No comments yet.