TL;DR
A profitable backtest can fail the trading goal. The selected NVDA version returned 22.06% from April to June 2024 but bought once and never sold, holding across sessions instead of daytrading. It failed four of five predeclared checks, including 12.73% drawdown above the 10% limit and lagging the stored 36% NVDA benchmark. Inspect complete rules, filled orders and holdings, and keep each trial in the ledger. Benchmark fees and dividends differ; these observations do not establish overfitting as the only cause.
- Later simulated return
- +22.06%
- Requirements failed
- 4 of 5
- Completed buy-and-sell pairs
- 0
It made money. It missed the trading goal.
- Genetic winner 2024-06-28, 20:00:00 EDT
- 12,205.98
- Original morning strategy 2024-06-28, 20:00:00 EDT
- 8,980.94
- NVDA buy and hold 2024-06-28, 20:00:00 EDT
- 13,600.01
- SPY buy and hold 2024-06-28, 20:00:00 EDT
- 10,371.61
Look beyond the profitable curve
The selected strategy bought NVDA once and never sold. It held the shares across trading days, even though the goal was to buy and sell within each day. Compare its curve with the original strategy and the buy-and-hold lines.
- NVDA buy and hold
- 36.00%
- Original strategy
- -10.19%
- Largest decline from a peak
- 12.73% (limit: 10%)
A rising balance can still miss your goal. Check the trades and the rules before deciding whether this is a strategy you want to use.
See how the optimizer changed the exit
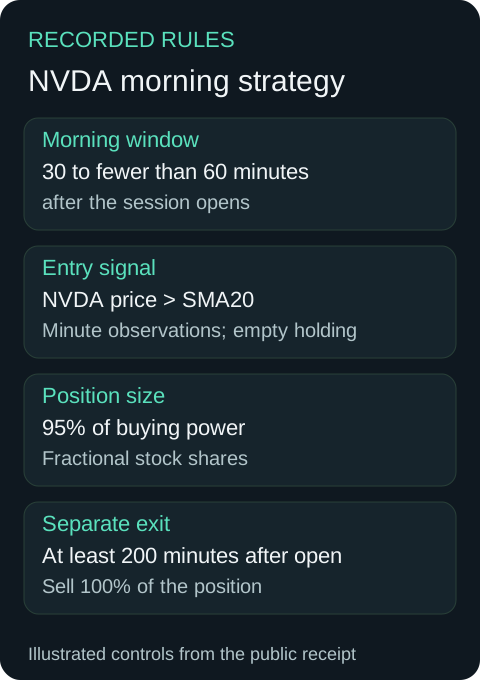
The original rules bought in the morning and sold the full holding later that day. The selected version required a holding worth more than $378,389.83 before selling, despite starting with $10,000. In the recorded later simulation, that exit never fired.
- Original exit
- Sell all at or after minute 200, with a position held
- Selected exit
- Sell 86.23% at minute 213, if the holding exceeds $378,389.83
- Recorded later orders
- One buy; zero sells
The selected rules describe a different trading behavior. Inspect the complete entry and exit together; checking only the return would miss this change.
Choose your checks before another search
Open the recorded example in Aurora. Ask it to explain the changed rules and help you define success for your own strategy: return, a comparison strategy, the largest loss you accept, enough completed trades and whether positions may stay open overnight.
A review and a test plan you can edit. The prepared request asks Aurora to wait before saving a portfolio or starting a paid research run.
We asked an optimizer to improve a strategy that buys and sells NVDA during the trading day. It selected rules that made money largely by holding the stock across days. The result looked attractive, but the strategy no longer behaved as intended.
An optimizer searches for rules with a better score on the data you give it. Here, the search rewarded return without enforcing the daytrading requirements. The later test exposed that mismatch.
What passed, and what failed?
These five requirements were used to judge the selected strategy on April 1 to June 28, 2024. A completed buy-and-sell pair means a position was opened and then closed. Drawdown is the decline from a previous peak in the portfolio balance.
Passed: make money
The later simulation returned 22.06%.
Failed: beat NVDA buy and hold
The stored comparison returned 36.00% over the same dates.
Failed: keep drawdown within 10%
The largest decline from a peak was 12.73%.
Failed: complete at least 10 buy-and-sell pairs
The strategy completed 0. It placed one filled buy and no sells.
Failed: close positions each day
It kept the NVDA holding across sessions until the simulation ended.
How does this relate to overfitting?
The unchanged morning strategy returned 10.69% in January to March, then -10.19% in April to June. That is why a strong development result needs a later check.
Overfitting happens when rules fit patterns in the historical data you studied that do not carry to other data. This example also exposes a separate problem: the search changed the intended trading behavior. These records do not establish overfitting as the only cause.
Before tuning a strategy, choose its goal and reserve dates you have not used to change its rules. These published dates are available for reproduction; they are already exposed to a reader of this page.
Advanced lab: exact search settings
- Development dates
- Jan 2 to Mar 28, 2024
- Population / generations
- 6 / 3
- Training / windows
- 75% / 1
- Final leaderboard
- 6 candidates; unique-trial count unavailable
The completed Parameter genetic search used six candidates per generation and three generations. It changed timing, comparisons, sizing and exits. It was broader than a three-value moving-average sweep.
A saved search plan, every final candidate and an inspection of what changed in the chosen rules.
Why repeated selection can flatter a backtest
Read how repeated choices use historical results
Try several moving-average lengths, keep the strongest one, then change the exit, date range or stocks until the curve looks better. Each choice uses information from those returns. You can make a convincing development chart through repeated selection even when the chosen rule does not perform similarly on later dates.
Use that process to understand what your search is doing. Save every attempt and the reason for each change, then assess the selected rule on a period you kept outside the search.
Example: keep a log of every attempt
Open an illustrative moving-average experiment
Use this illustrative experiment design and fill the return, drawdown and turnover columns from your own completed tests. Choose the score and acceptable behavior before comparing candidates.
Scroll sideways to compare all columns. Select a heading to sort.
| A | Price above SMA20 | How a short trend rule behaves on development dates |
| B | Price above SMA50 | Whether a slower rule changes turnover and drawdown |
| C | Price above SMA100 | Whether the same hypothesis persists with a longer lookback |
| Selected rule | Freeze one candidate and its exit | Which exact rule will face the unseen test |
No matching rows. Clear the filter to see all records.
Research ledger: what to record
Open the checklist of dates, assets, costs and objectives
Inspect the trades behind the curve. Ask whether a small number of events drove the improvement, whether the candidate stays mostly in cash, and how its drawdowns compare with the benchmark over matching dates.
| Choice | Useful research record |
|---|---|
| Parameter search | Every length and threshold tried, including rejected trials |
| Changing dates | The original dates and why a new period was added |
| Changing assets | The fixed universe and every name added or removed |
| Changing costs | The fee and execution assumptions before and after the change |
| Choosing a score | The original objective and any later replacement |
No matching rows. Clear the filter to see all records.
Use earlier research to plan your next experiment
Open the corpus research request
Start with existing experiments. Compare the whole rule and its test inputs, including weaker examples, before choosing a signal. Save the dates you inspected in your research notes so you can reserve a later test.
Before creating a technical trend strategy, inspect the existing backtest corpus. Search for completed prior examples using these indicator types: Price, SimpleMovingAverage, with comparable tickers, cadence and asset class. Examine both stronger and weaker completed examples and their actual rules, dates, capital, fees, turnover and benchmark. Screen the corpus for a more specific cohort or named strategy when needed. Show the returned records and any filters you widened. Explain which ideas recur and which trades account for the results. Record the historical periods you inspected. Propose three bounded variants and a development period; keep a later unseen test outside the selection. Stop at the research plan.Inspect which trades improved the result
Open the development-result review request
Compare my completed development variants using the same dates, capital, universe, fees and benchmark. Show every trial, including rejected ones. Explain which signals and trades account for the improved curve and which parameters or date choices were selected after seeing results. Inspect the recorded backtest events at the relevant timestamps. Keep the later unseen test outside this comparison. Save the selected configuration and the objective before evaluating it there.Keep later testing separate from development
Read what to do after a later test
Run the frozen candidate on the unseen period. Compare the same score, drawdown, turnover and benchmark, and inspect the new trades. If the outcome motivates a revision, keep that result in your research ledger and begin a new development cycle with another untouched test.
No comments yet.