TL;DR
Holding the 10 largest US companies with a weekly rebalance returned +250.8% from January 2, 2020 to October 20, 2026. SPY returned +160.1% with dividends. When I kept only large companies whose average news sentiment over the prior 60 trading sessions was positive, the return was also +250.8%. The worst drawdown shrank from -41.4% to -31.6%, and the 2022 loss fell from -37.9% to -18.9%.
Two controls explain that smoother ride. Keeping only negative-news companies roughly halved the 2022 loss too. Holding the 20 largest companies with no news filter had an even smaller worst drawdown, -29.3%, and the same 0.93 Sharpe ratio. Adding the positive-news filter to the top 20 cut its return from +223.7% to +140.7%, because it kept skipping Meta, Tesla and Apple during their 2023 and 2024 rallies. I found no evidence that the direction of the news helped.
Watch the test, with the curves shown
The 10 largest US companies beat SPY
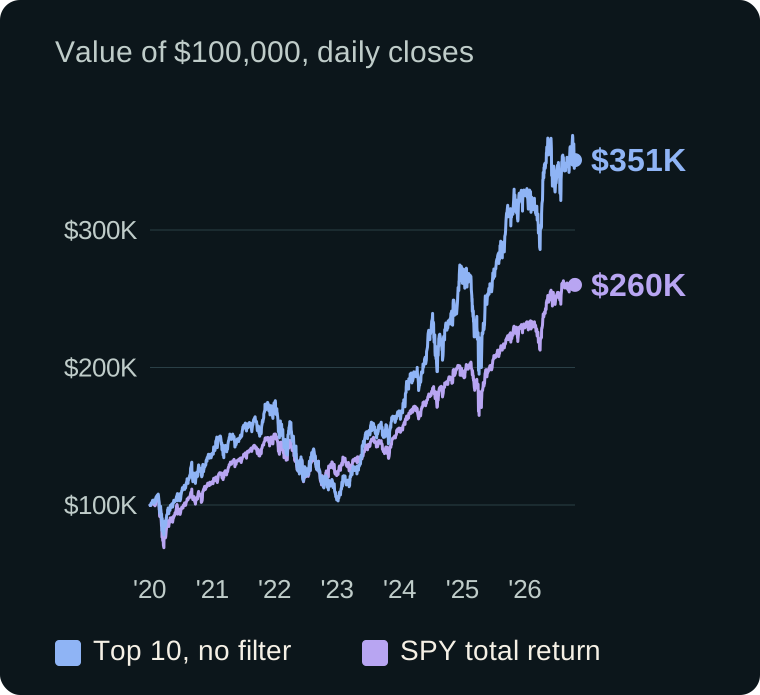
The simplest active rule I know holds the 10 largest US companies at 10% each and rebalances every week. $100,000 grew to $350,842. The same amount in SPY, with dividends reinvested, grew to $260,067. The top 10 also fell harder, with a worst drawdown of -41.4% against -34.1% for SPY.
Part 2 found no reliable return signal in news sentiment
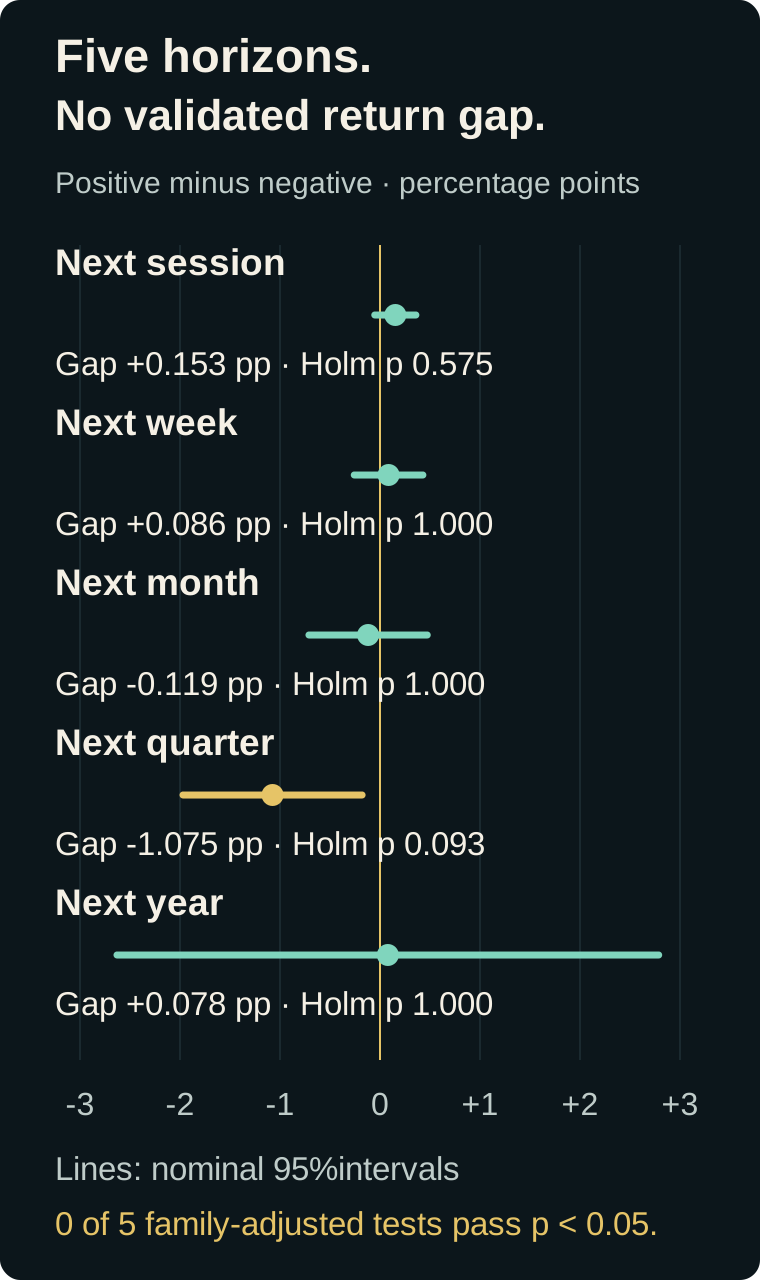
In Part 2, I compared positive-news and negative-news companies over the next session, week, month, quarter and year. None of the five gaps held up after correcting for five tests (every adjusted p-value was 0.093 or higher). I still wanted to know whether sentiment could improve a strategy that already works.
The experiment: one news filter in front of the top 10
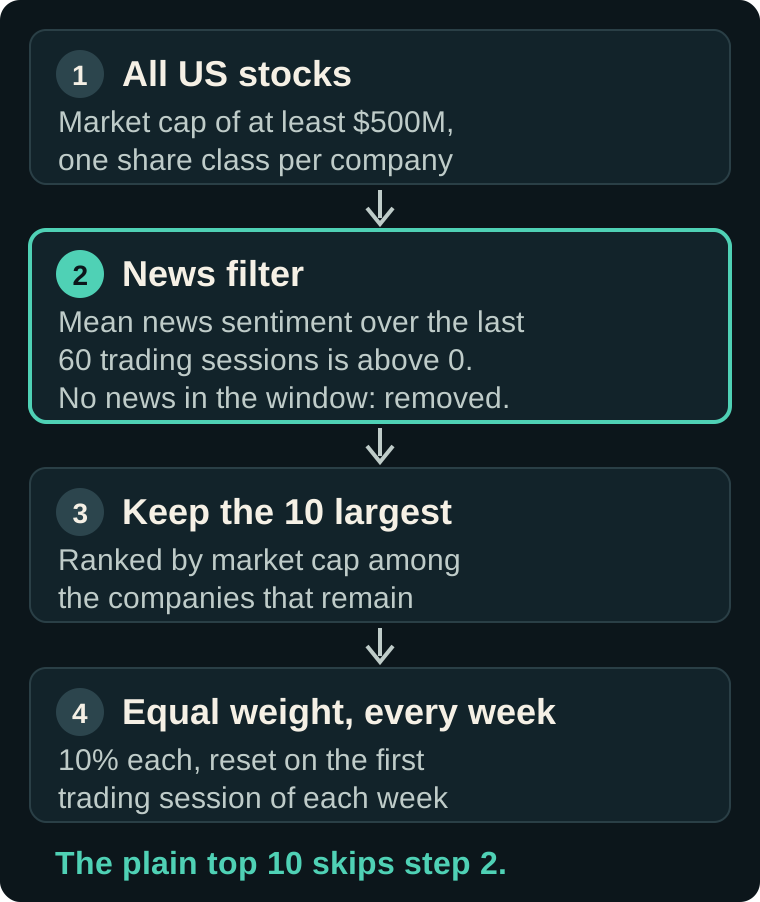
The test keeps every part of the weekly rule and adds one filter before the ranking. Sentiment scores come from GDELT headlines scored by the NexusTrade news classifier, with one snapshot per trading session at 9:15 a.m. New York time.
The same return, with a smaller worst drop
Portfolio value (USD)
- Top 10, positive news (60 sessions) 2026-10-20
- $350,791.21
- Top 10, no filter 2026-10-20
- $350,841.90
- Top 10, negative news (control) 2026-10-20
- $318,809.76
- SPY total return 2026-10-20
- $260,067.09
Top 10, positive news (60 sessions): 31.56% largest decline in plotted observations. 2020-02-19 ($106,113.73) to 2020-03-23 ($72,627.79).
Show the table · 4 rows, 6 columns
Scroll sideways to compare all columns. Select a heading to sort.
| Top 10, no filter | $350,842 | +250.8% | 20.3% | -41.4% | 0.84 |
| Top 10, positive news (60 sessions) | $350,791 | +250.8% | 20.3% | -31.6% | 0.93 |
| Top 10, negative news (60 sessions) | $318,810 | +218.8% | 18.6% | -33.6% | 0.90 |
| SPY total return | $260,067 | +160.1% | 15.1% | -34.1% | 0.80 |
No matching rows. Clear the filter to see all records.
Full window 2020-01-02 to 2026-10-20, $100,000 start. Sharpe uses daily returns, annualized, with a zero risk-free rate.
The positive-news filter ended at $350,791, against $350,842 for the unfiltered top 10, so both returned +250.8%. Its worst drawdown was -31.6%, against -41.4%, and its Sharpe ratio was 0.93 against 0.84. Hover or tap the chart to compare values on any date.
In 2022, the filter lost half as much
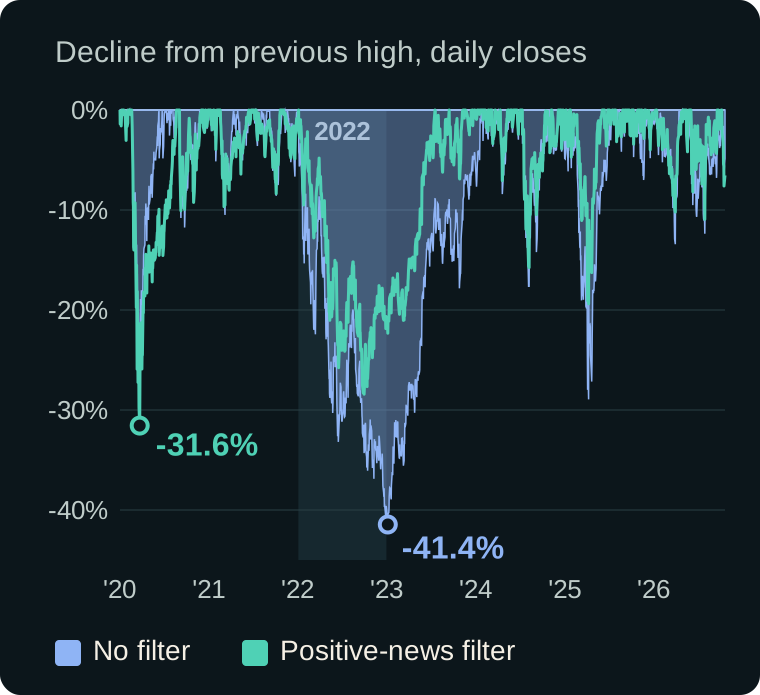
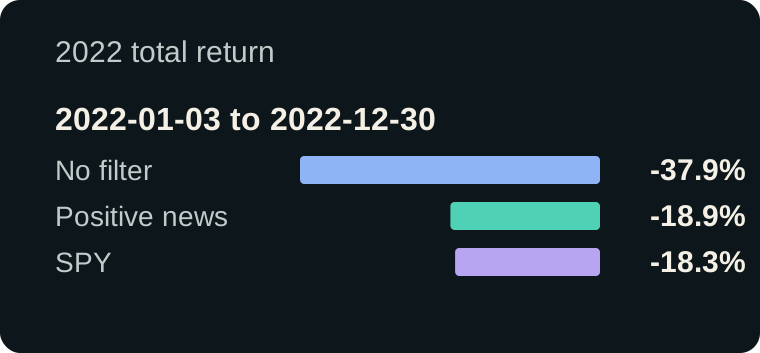
The unfiltered top 10 lost 37.9% in 2022 and the filtered version lost 18.9%, close to SPY's 18.3%. The filtered version's deepest drop over the full window came in early 2020.
Calendar years: the filter led in three of seven
Show the table · 7 rows, 4 columns
Scroll sideways to compare all columns. Select a heading to sort.
| 2020 | +16.9% | +37.5% | +17.1% |
| 2021 | +13.7% | +24.3% | +28.8% |
| 2022 | -18.9% | -37.9% | -18.3% |
| 2023 | +32.8% | +57.6% | +26.2% |
| 2024 | +50.2% | +56.3% | +25.0% |
| 2025 | +39.0% | +24.4% | +17.7% |
| 2026 (to Oct 20) | +17.4% | +7.9% | +13.7% |
No matching rows. Clear the filter to see all records.
Calendar-year total return. Each year starts from the prior year-end value.
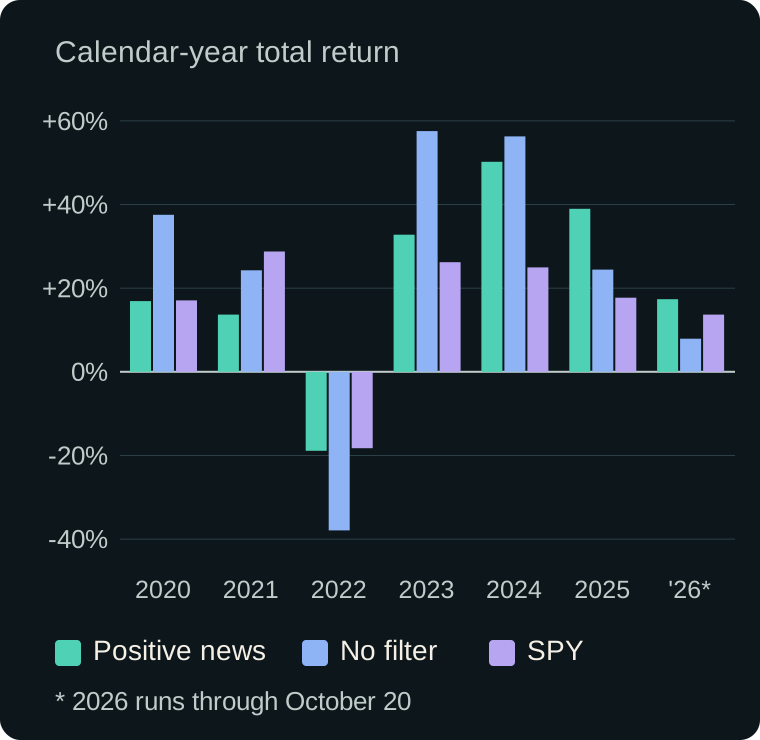
The filter gave up the most in 2020 and 2023, when the unfiltered top 10 gained +37.5% and +57.6%. It finished ahead in 2022, 2025 and 2026 so far.
Rolling windows: a shallower drawdown almost every time
Show the table · 3 rows, 6 columns
Scroll sideways to compare all columns. Select a heading to sort.
| 1 year | 292 | 58% | 97% | 71% | +1.7 |
| 2 years | 241 | 71% | 96% | 83% | +6.9 |
| 3 years | 191 | 73% | 100% | 97% | +7.7 |
No matching rows. Clear the filter to see all records.
Positive-news filter compared with the unfiltered top 10 inside each window. pp means percentage points.
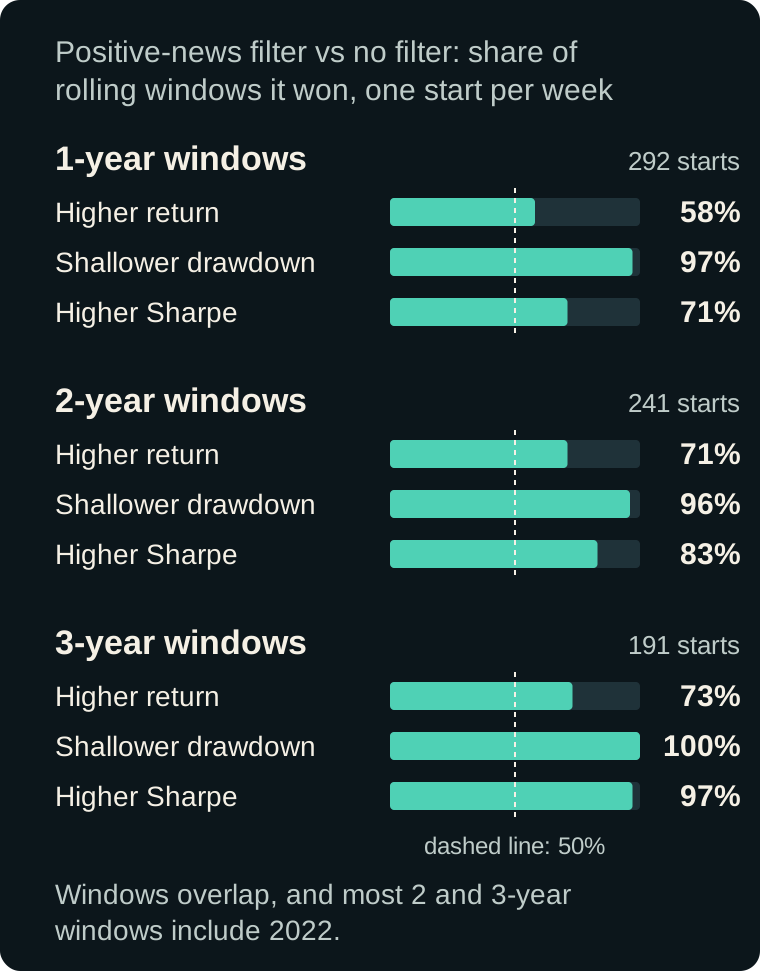
Over every 3-year window (191 of 191), the filtered version had the shallower worst drop, and it had the higher Sharpe ratio in 186 (97%). Its total return was higher in 58% to 73% of windows, with a median gap between +1.7 and +7.7 percentage points.
Keeping negative-news companies also cut the risk
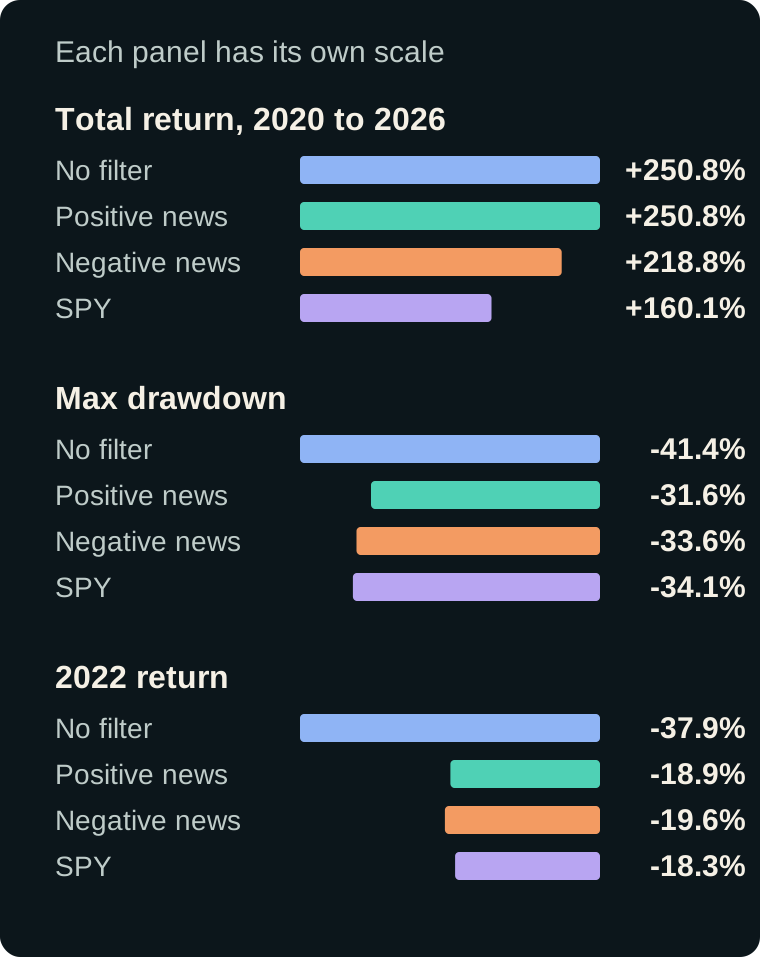
As a control, I flipped the filter and kept only companies with negative average news. It lost 19.6% in 2022, about the same as the positive filter. Across rolling 1, 2 and 3-year windows it also had the shallower drawdown in 86%, 96% and 100% of them, and the higher Sharpe ratio in 75%, 93% and 99%.
That suggests the smoother ride comes from how any news filter changes which megacaps the strategy holds. The direction of the news looks secondary.
Every lookback I tried cut the drawdown
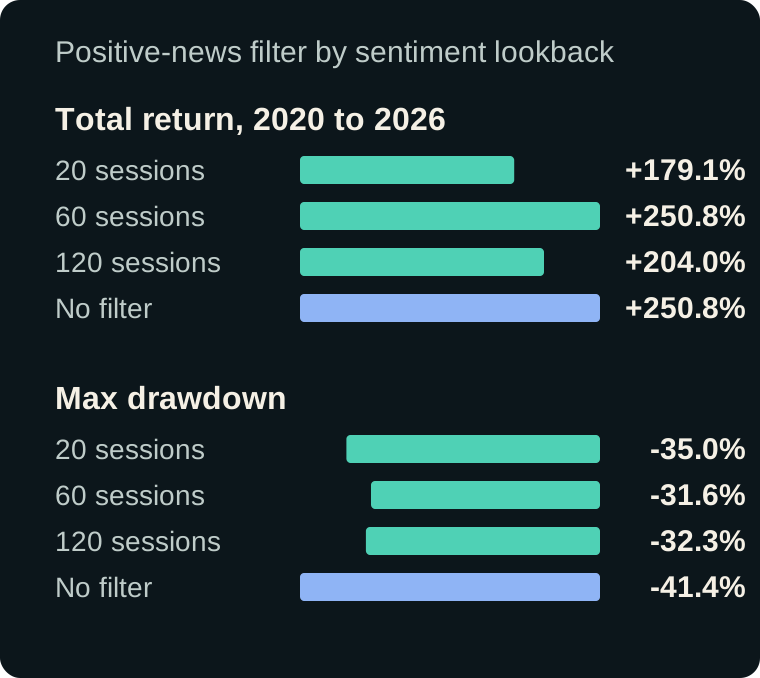
With a 20, 60 or 120-session sentiment average, the worst drawdown stayed below the unfiltered top 10. The 20 and 120-session versions returned less in total, and the 60-session version matched it.
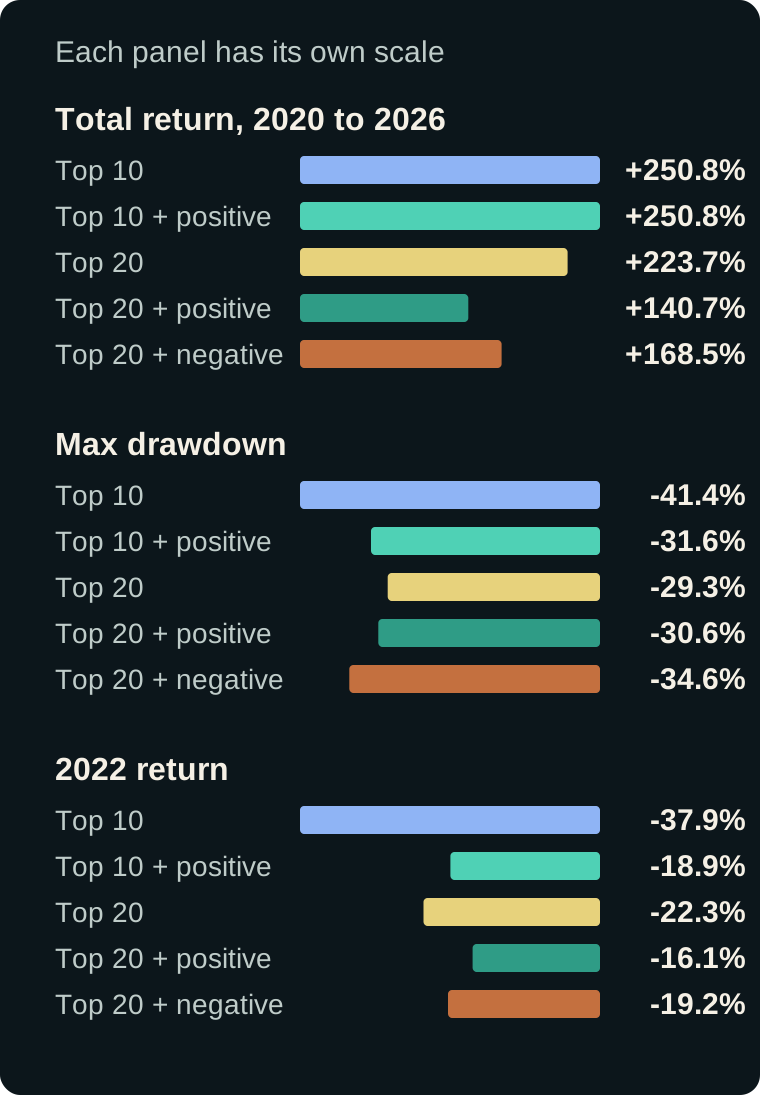
Holding the top 20 smoothed the ride with no news at all
Show the table · 6 rows, 6 columns
Scroll sideways to compare all columns. Select a heading to sort.
| Top 10, no filter | $350,842 | +250.8% | -41.4% | 0.84 | -37.9% |
| Top 10, positive news (60 sessions) | $350,791 | +250.8% | -31.6% | 0.93 | -18.9% |
| Top 20, no filter | $323,742 | +223.7% | -29.3% | 0.93 | -22.3% |
| Top 20, positive news (60 sessions) | $240,681 | +140.7% | -30.6% | 0.75 | -16.1% |
| Top 20, negative news (60 sessions) | $268,491 | +168.5% | -34.6% | 0.82 | -19.2% |
| SPY total return | $260,067 | +160.1% | -34.1% | 0.80 | -18.3% |
No matching rows. Clear the filter to see all records.
Full window 2020-01-02 to 2026-10-20, $100,000 start. Same weekly rebalance, 0.1% fee per fill and reinvested dividends for every portfolio.
A news filter swaps some of the largest companies for smaller ones further down the market-cap list. To test whether that swap explains the result, I held the 20 largest companies at 5% each with no news filter. Its worst drawdown was -29.3%, smaller than either news version of the top 10, and its Sharpe ratio was 0.93, equal to the positive-news filter. It returned +223.7% and lost 22.3% in 2022.
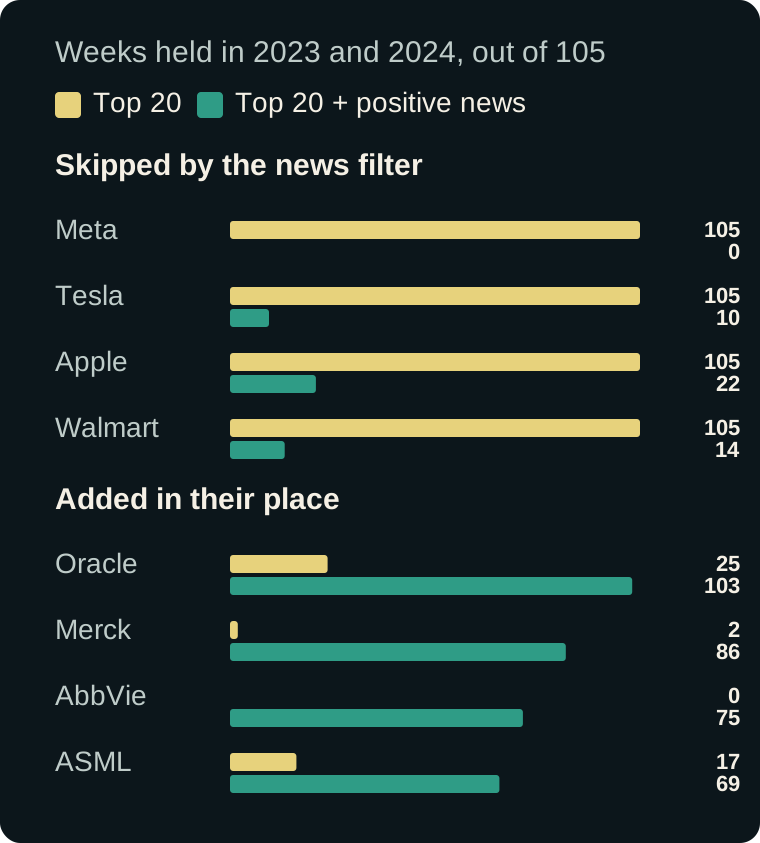
Adding news to the top 20 lowered the return
Show the table · 8 rows, 5 columns
Scroll sideways to compare all columns. Select a heading to sort.
| META | 52 | 0 | 53 | 0 |
| TSLA | 52 | 10 | 53 | 0 |
| AAPL | 52 | 20 | 53 | 2 |
| WMT | 52 | 9 | 53 | 5 |
| ORCL | 6 | 51 | 19 | 52 |
| MRK | 2 | 46 | 0 | 40 |
| ABBV | 0 | 28 | 0 | 47 |
| ASML | 0 | 32 | 17 | 37 |
No matching rows. Clear the filter to see all records.
Weeks each portfolio targeted the company at its weekly rebalance, out of 52 in 2023 and 53 in 2024. GOOG and GOOGL count as one company.
Then I applied each news filter to the top 20. The positive-news version returned +140.7% and the negative-news version +168.5%, both below the plain top 20 and both with a lower Sharpe ratio. Most of the gap came in 2023 and 2024, when the positive-news top 20 gained +21.6% and +27.2% against +41.7% and +39.6%.
Average news tone behaves like a lasting trait of each company. Meta, Tesla and Apple drew negative coverage for most of this period, so the positive filter kept them out during their largest rallies and filled the slots with companies such as Oracle, Merck, AbbVie and ASML.
What I take from this
Filtering the top 10 by news sentiment kept the same return with a smaller worst drawdown. Flipping the filter to negative news did nearly the same, and holding the top 20 with no news did it with a smaller drawdown still. On the top 20, both news filters lowered the return.
The smoother ride came from spreading the portfolio past the very largest companies. News sentiment added nothing I could measure, which matches what Part 2 found.
Limits of this test
This is screening-grade evidence from one 6.8-year history with one major bear market. Most 2 and 3-year windows include 2022, so the rolling-window counts overlap heavily.
The news labels come from a classifier trained in 2026 and applied to archived headlines. The backtest reads each daily snapshot only from its 9:15 a.m. session time, and a live forward test is still needed.
Build the three versions yourself
Aurora can create the portfolios and backtest them over the same window. Compare the drawdown and the 2022 row first.
Definitions and data
Inspect the definitions and download the data
Universe: all US stocks with a market cap of at least $500 million, one share class per company. Trigger: the first trading tick of each new trading week. The filter runs over the full universe before the 10 largest are selected, and each selected company gets an equal 10% target weight. Every version stays nearly fully invested, with median cash of about 1.5%.
News sentiment is the mean of daily company scores from -1 to 1 over the last N trading sessions. A company with no news in that window has no mean and is excluded. Coverage begins September 23, 2019.
Maximum drawdown and Sharpe ratio use daily closing values. Sharpe is the annualized mean of daily returns divided by their standard deviation, with a zero risk-free rate. Calendar-year returns start from the prior year-end value.
No comments yet.