TL;DR
Across the next session, week, month, quarter and year, this study did not establish a reliable return difference between positive-news and negative-news companies after accounting for five primary tests. Adding the sentiment score to recent prices, volatility and story count changed held-out prediction error by less than 0.001% at every horizon.
The quarterly comparison leaned negative by 1.075 percentage points, with a multiple-comparison-adjusted p-value of 0.093. It is a lead for another study. These results test a fixed daily sentiment level; a separate completed test of unusual tone changes and coverage bursts also found no reliable incremental gain.
Watch the results, with the comparisons shown
The five results, with uncertainty visible
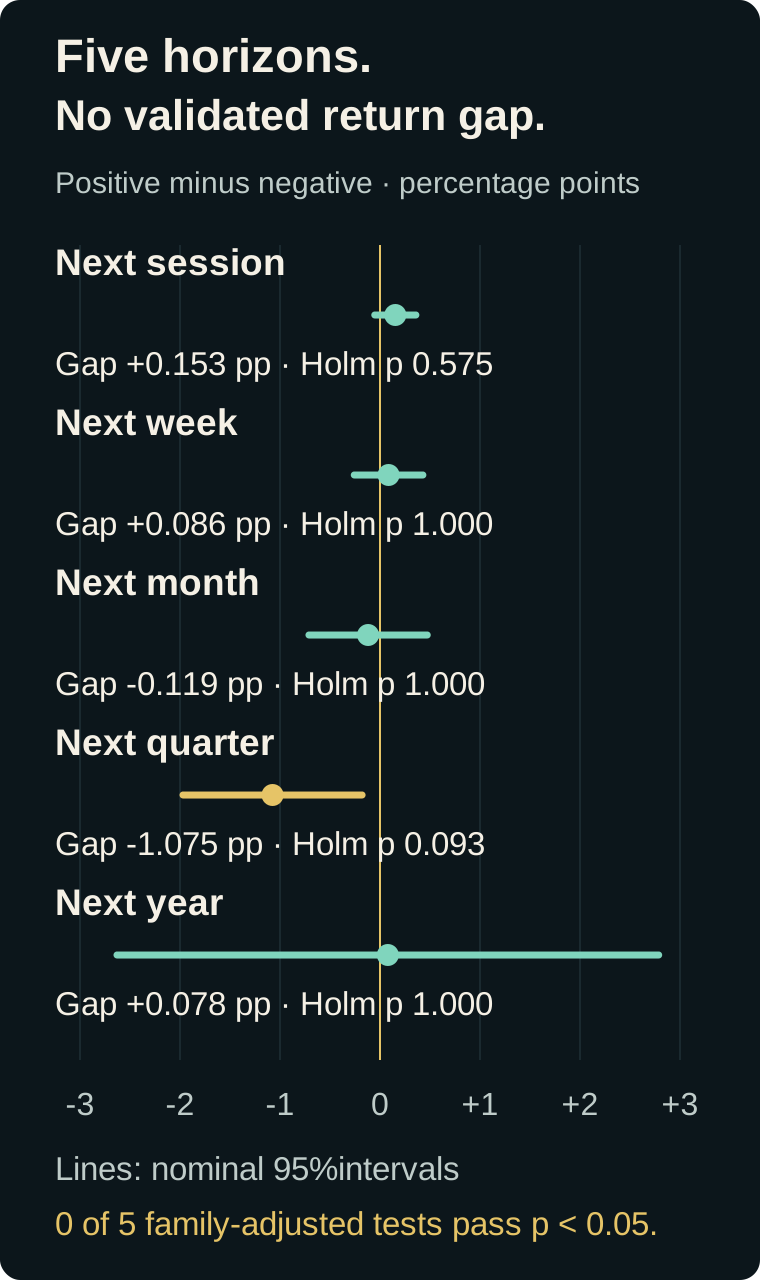
Show the table · 5 rows, 6 columns
Scroll sideways to compare all columns. Select a heading to sort.
| Next session | 1,465,601 | +0.153 | [-0.052, +0.359] | 0.1439 | 0.5755 |
| Next week | 1,455,419 | +0.086 | [-0.257, +0.429] | 0.6243 | 1.0000 |
| Next month | 1,431,099 | -0.119 | [-0.710, +0.472] | 0.6932 | 1.0000 |
| Next quarter | 1,359,156 | -1.075 | [-1.970, -0.179] | 0.0187 | 0.0933 |
| Next year | 1,057,726 | +0.078 | [-2.630, +2.787] | 0.9548 | 1.0000 |
No matching rows. Clear the filter to see all records.
Exact comparison values, rounded for display. Complete company days include every observable sentiment group; date-level gaps require at least ten positive and ten negative companies. pp means percentage points. These are overlapping event-window comparisons.
Read the explanation
If positive company news predicts better subsequent returns, the points should sit consistently to the right of zero. They do not. The next-session estimate is +0.153 percentage points, while the quarterly estimate is -1.075 points. The annual estimate is near zero, with a wide interval.
We asked the question over five holding periods. Looking in more places creates more chances for an apparent pattern to arise by luck, so we required stronger evidence before calling a result convincing. Given the observed uncertainty in the quarterly comparison, the absolute return gap needed to exceed about 1.18 percentage points under the existing five-comparison check. The measured shortfall was 1.075 points. This is a statistical evidence cutoff for this comparison, not a universal minimum profitable return.
The line through each dot shows its nominal 95% uncertainty interval. The p-values at the right account for testing five horizons with the Holm procedure. None falls below the prespecified 0.05 threshold. The quarterly interval misses zero on its own, but its multiple-comparison-adjusted p-value is 0.093.
That is enough evidence to withhold a trading rule based only on this sentiment level. It leaves open narrower hypotheses, different news features and event-specific effects.
What was in the dataset?
The frozen sample contains 2,265,184 company days across 8,472 issuers and 8,604 representative securities. The news runs from September 23, 2019 through October 20, 2026. The frozen outcome-price sample ends October 19, 2026. The incomplete October 20 publication observed during the audit was subsequently repaired; it is outside these frozen research outcomes.
There are 9,464,385 unique story-company-session inputs after deduplication, drawn from 10,062,452 classifier label rows. One story can concern several companies, so this is not a count of globally distinct articles. Related copies first share one story-level score; stories then receive equal weight within the company day.
A score above zero enters the positive group; below zero enters the negative group. Exactly zero is neutral. Missing news remains missing. Dated security ownership prevents joining a company to an unrelated firm that later reused its ticker.
Show the table · 6 rows, 3 columns
Scroll sideways to compare all columns. Select a heading to sort.
| All sample company days | 2,265,184 | A company observed on a news session |
| Issuers | 8,472 | Company identities |
| Representative securities | 8,604 | Dated security identities |
| Story-company-session inputs | 9,464,385 | Deduplicated within the research unit |
| Source label rows | 10,062,452 | Classifier input records |
| Held-out company days before outcomes | 1,474,336 | Signal dates starting January 3, 2023 |
No matching rows. Clear the filter to see all records.
The clock starts at the observed opening price
The daily news snapshot is taken at 9:15 a.m. New York time. Entry uses that session's 9:30 a.m. opening price. The one-session outcome exits at that day's close. The longer windows contain 5, 21, 63 or 252 exchange sessions.
For each company we calculate its price return and subtract SPY's return over the identical entry and exit window. Within each date, we compare the equally weighted positive and negative company groups. We then average those date-level gaps with equal date weights. Dates need at least ten companies in each comparison group.
We developed the financial models on 2019 through 2021, used 2022 for validation, and evaluated on signal dates starting January 3, 2023. Before each boundary, we removed training observations whose outcome window reached across it.
Did sentiment improve a model that already knew prices?
The baseline used recent 1, 5, 21 and 63-session returns, 20-session volatility, and story count. The second model added sentiment on exactly the same observations. Its relative change in held-out mean squared prediction error stayed below 0.001% in magnitude at every horizon.
Story count is already in the baseline. This comparison measures the incremental value of the sentiment score. It does not test every possible use of the archive, and it does not isolate the causal effect of news on a stock.
Show the table · 5 rows, 2 columns
| Horizon | Relative MSE improvement |
|---|---|
| Next session | +0.000160% |
| Next week | +0.000113% |
| Next month | -0.000018% |
| Next quarter | +0.000053% |
| Next year | -0.000612% |
No matching rows. Clear the filter to see all records.
Positive means the sentiment model had lower prediction error; negative means higher error. Models use matching observations and training-only scaling.
A few extreme price moves can move the average
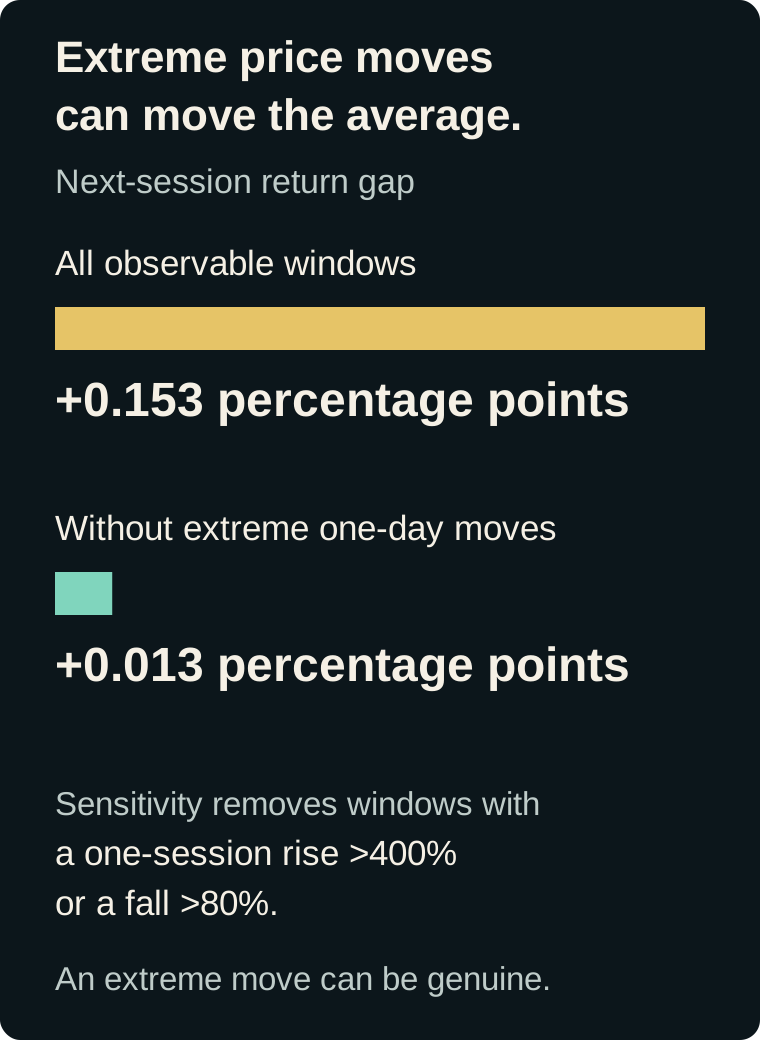
The main results retain every observable price window. A separate sensitivity check removes a window if it contains a single-session rise greater than 400% or a fall greater than 80%, including the entry open to same-day close.
For the next session, that changes the estimated gap from +0.153 to +0.013 percentage points. Both remain inconclusive. A sharp move can be real news, and an extreme print can also be a vendor problem. The filter alone does not distinguish them.
The latest source repair covered ten securities and 17 ticker histories, including eight securities and 11,144 frozen-study rows. Reviewed corporate-action errors were corrected and eight missing raw OHLC sessions were recovered from documented as-traded prices. All 22,973 reviewed native rows across those 17 histories were verified; corrected published history was also read back. This is a bounded repair, not certification of every price in the lake. Broader provider/native differences remain under review.
Would a sudden change in news work better?
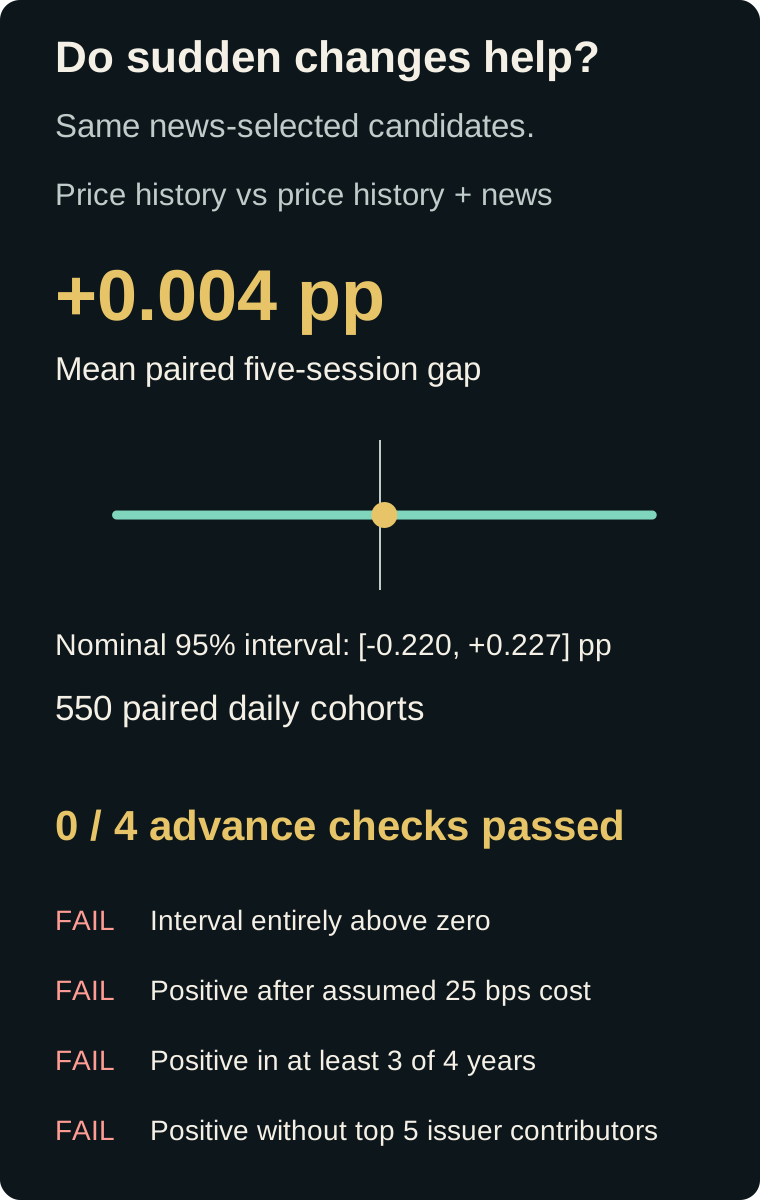
Read the explanation
This follow-up observes the signal-day closing reaction, enters at the next session opening price, and exits at the fifth session close. It reuses the already inspected 2023 to 2026 evaluation period, so it is not an untouched confirmation sample.
Tone change is measured against the prior 20 news-covered observations. Candidates need at least three deduplicated stories and at least three times average coverage over the prior 60 exchange sessions; covered days without news count as zero coverage. The 10th and 90th percentile tone-change cutoffs were fitted on 2019 to 2021.
The next fixed test selected unusually sharp sentiment changes and bursts of coverage, then ranked the same news-selected candidate pool in two ways. Both rankings used recent price history. One also included the news features. This asks whether news improves the ordering of those candidates; the comparison already knows which companies entered that news-defined pool.
Across 550 complete paired daily cohorts, adding news produced an average five-session difference of +0.004 percentage points. Its nominal 95% HAC interval runs from -0.220 to +0.227 points. That point estimate is near zero, with uncertainty in both directions. It does not establish equivalence.
All four checks set before this test failed. Only two of four evaluated years had a positive increment. The news-ranked cohort averaged -0.340 percentage points versus SPY before costs and -0.590 points after an assumed 25-basis-point cost. Equal costs cancel when comparing the two rankings; that does not make either cohort profitable or establish real fills.
One selected SIVB position lacks both its intended March 10, 2023 entry price and March 16 exit price. It remains explicitly missing. Each model selected 1,286 positions over 551 dates; 550 dates had complete paired outcomes. These overlapping five-session cohorts are research comparisons, not a funded portfolio backtest.
The one-year result has much less independent history
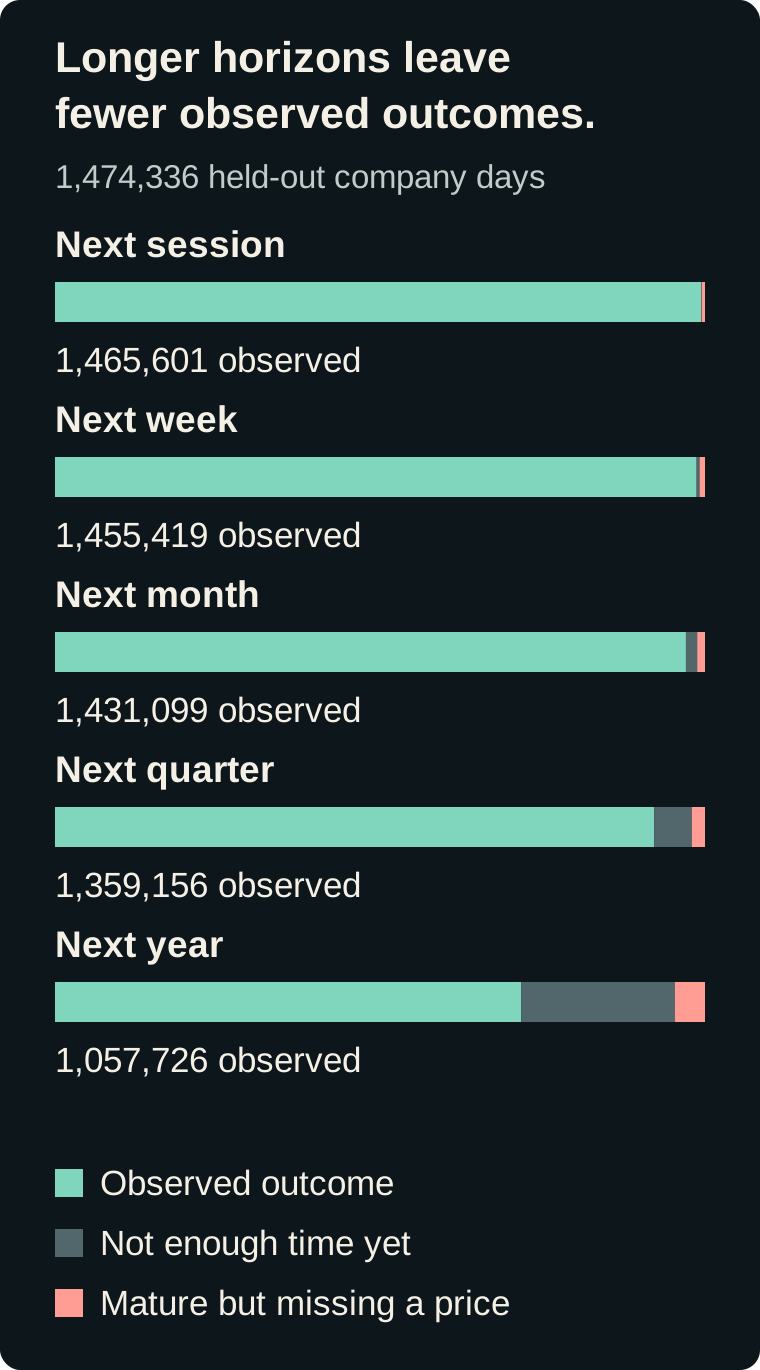
The annual comparison has 1,057,726 observable held-out company days, but its 690 daily anchors overlap heavily. They span only about 2.74 nonoverlapping year-length blocks. A million rows do not become a million independent annual experiments.
For mature annual observations, 68,383 company days lack an entry or exit outcome, or 6.07% of mature candidates. Missing merger and delisting settlements were not replaced with zero returns, total losses or prices from another company. The reported results are conditional on observable outcomes and can be affected by that selection.
What would make the next result more convincing?
We built the classifier in 2026, then used it to score older news. For most historical records, availability comes from news-archive batch timestamps. Those tell us when the archive recorded a story; they do not establish when our own system received it, scored it and could have acted on it at the time. A prospective test must record those steps as they happen.
Eleven exchange sessions have no published source articles or ticker labels in the audited sample. Historical size and sector controls were not certified. Mixed volume-adjustment bases also prevented a dependable historical dollar-volume control. Those gaps leave alternative explanations for an observed association.
A useful next investigation should freeze its hypothesis before inspecting returns, require usable prices and liquidity rules chosen without later outcomes, and preserve real future scoring timestamps.
Ask Codex to inspect the result
Inspect the request
Connect the NexusTrade MCP server and install the official NexusTrade SDK. Start with a bounded read that checks one comparison and its outcome coverage before expanding the request. The completed study used these tools without run_compute.
Statistical and data details
Inspect the technical appendix
The fixed retrospective classifier is xenc-v3-s42-e3-7b7211a0aace. Story-root deduplication and target resolution precede the issuer-day average. For 50,379 multi-security company days (2.22%), a deterministic minimum tagged security ID represents the issuer, selected without outcomes.
Inference uses daily aggregates with HAC lags max(5, horizon - 1). The nominal 95% intervals address serial dependence and overlapping windows; Holm correction covers five primary held-out tests. Annual overlap remains a material limitation despite this adjustment.
In the timing audit, 10,055,967 of 10,062,452 label rows (99.94%) matched reconstructed archive timing. This percentage measures the provenance of record timing, not classifier accuracy or the percentage of bad data. Historical available_at uses the earliest GDELT source-batch time. The reconstructed labelled_at value adds five minutes as metadata; signal placement uses availability time and the exchange-session cutoff, not that added lag.
Lake OHLC prices are split adjusted and exclude dividends. This study measures gross price returns. Dividend payments belong separately in backtesting. Fees, financing, borrow, auction fills and terminal settlements are outside these event-window comparisons.
The independently implemented verifier recomputed endpoint returns, date-level group gaps, HAC intervals, Holm correction, model predictions and prediction error for all five horizons. The revised run preserves the original hypotheses and all unreviewed frozen observations. Both study seals and an independent numerical audit bind this release. These are two completed retrospective tests.
No comments yet.