TL;DR
Material UI can be slow on pages that re-render often. MUI styles components with Emotion, which turns style objects into CSS in the browser on every render, and that work adds up when a page re-renders many times.
I moved NexusTrade's most-viewed pages and its shared header to static CSS modules. Measured on production builds at 4x CPU, load-time long frames fell 33% on the dashboard, 40% on the watchlist and 36% on Live Trading. A page that renders once barely changed.
My answer to whether you should still use Material UI is no. Coding models now write and maintain plain CSS as quickly as MUI's ready-made components ever saved you, so use MUI only when implementation velocity matters more than page velocity.
Results by page
Median of three page loads per build. Negative is faster.
Show the table · 9 rows, 5 columns
Scroll sideways to compare all columns. Select a heading to sort.
| Dashboard | 2,449 | 1,652 | 1,577 | 707 |
| Watchlist | 2,574 | 1,537 | 1,520 | 683 |
| Watchlist, a list open | 2,886 | 1,870 | 1,591 | 713 |
| Live Trading | 2,253 | 1,436 | 511 | 54 |
| Aurora chat (shell only) | 1,912 | 1,436 | 887 | 698 |
| Portfolio dashboard | 2,277 | 1,781 | 1,530 | 814 |
| Aurora chat | 2,189 | 1,843 | 1,258 | 763 |
| Profile | 1,394 | 1,248 | 288 | 134 |
| Learn course | 945 | 957 | 315 | 295 |
No matching rows. Clear the filter to see all records.
Medians of three loads, in milliseconds. Long frames are animation frames of 50 ms or more; data-load frames are the long frames started by an API response.
Phase 1 migrated the bodies of the chat, portfolio dashboard, profile and Learn pages. Phase 2 migrated the shared header, footer and page template, then the dashboard, watchlist and Live Trading pages.
The chat page shows how much the shell mattered: its body had already moved in phase 1, and moving only the header cut another 25%.
Should you still use Material UI?
No. For new work, write plain CSS instead.
MUI's value was ready-made components that let you build quickly. Coding models such as Claude Opus 5.5 and Sol now write that CSS just as quickly, express designs more freely than a component library allows, and maintain it as the design changes. That leaves MUI's runtime cost with nothing to pay for it.
Use MUI only when implementation velocity matters more than page velocity, such as a quick prototype or an internal tool.
The runtime cost is real
Moving sx to CSS modules cut long-frame time 33% on the NexusTrade dashboard and 40% on the watchlist.
The visual result does not depend on MUI
Every page I migrated renders within 0.65% of its original pixels, so users see the same product.
Where the time went
Each time a component with an sx prop renders, Emotion reads the theme, merges the component's default, theme and variant styles with the sx object, and resolves shortcuts such as p: 2 into pixels. It then serializes the result into a CSS string, hashes it, checks a cache, and inserts a new rule when the hash is new. Inserting a rule makes the browser recalculate styles for the page.
That runs for every styled element on every render, even when nothing visual changed. Each MUI element is also several React components deep, so React has more of the tree to walk.
A CSS module replaces all of that with a class name fixed at build time. The browser parses the CSS once, when the file loads, and a re-render just sets the class on a plain element.
Pages that re-render often gain the most
The NexusTrade dashboard re-renders as each API response arrives (the app runs React 17, which does not batch those updates), so the styling work repeated many times per load.
Pages that render once gain little
The Learn course page went from 945 ms to 957 ms, a change inside the run-to-run noise.
The shared shell was the hidden cost
After phase 1, the migrated pages still spent 7 to 9% of their JavaScript time inside Emotion, about the same as pages I had not touched. Counting Emotion-styled elements by page region showed why.
Two header menus, the profile menu and the mobile menu, were mounted on every page and hidden. MUI's keepMounted prop kept about 190 styled elements in the page, invisible, on desktop and phone alike. Removing that prop was a two-line change.
Show the table · 5 rows, 6 columns
Scroll sideways to compare all columns. Select a heading to sort.
| Aurora chat (migrated) | 10 | 80 | 21 | 192 | 312 |
| Portfolio dashboard (migrated) | 101 | 80 | 75 | 192 | 461 |
| Dashboard | 341 | 80 | 139 | 192 | 765 |
| Live Trading | 247 | 102 | 75 | 192 | 638 |
| Watchlist | 382 | 125 | 159 | 192 | 880 |
No matching rows. Clear the filter to see all records.
Emotion-styled elements on the page after phase 1, by region, at 1440 px.
Pick pages by traffic and re-render count
I picked the phase 2 pages from 30 days of signed-in page views. The dashboard alone was 36% of views. Backtest and strategy pages carried the most sx props in the codebase but did not make the top 25 pages by views, so I left them.
I migrated the pages with the most traffic first, starting with the shared header that every page renders.
The download got bigger
The styles moved from JavaScript objects into CSS files, which the browser handles far more cheaply but still has to download. JavaScript barely shrank because NexusTrade still ships MUI and Emotion for the menus, dialogs and form fields it has not replaced yet. The bundle shrinks when the last MUI import goes.
Short hashed class names in production builds saved about 6 KB, because each class name appears in the CSS and again in the JavaScript class map.
- Phase 1 first load
- 1,815 to 1,918 KB+5.7% gzipped
- Phase 2 first load
- 1,918 to 1,937 KB+19 KB gzipped
Proving the pages still look the same
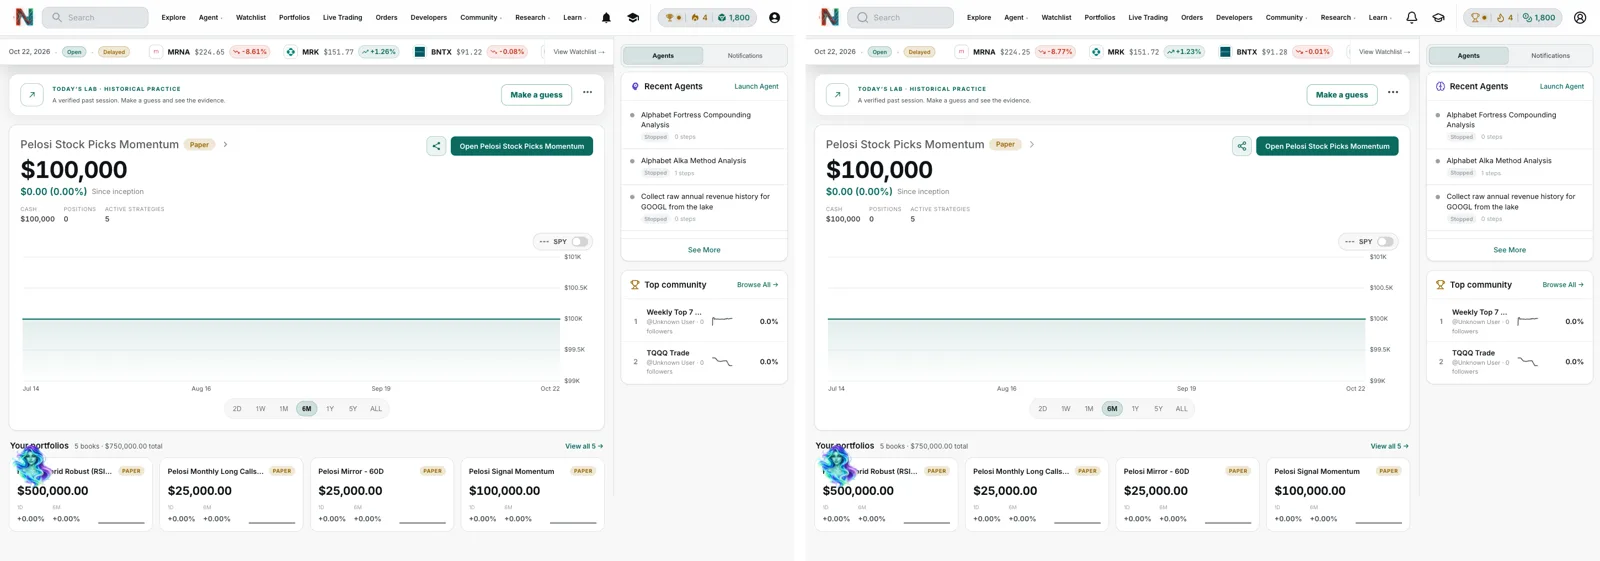
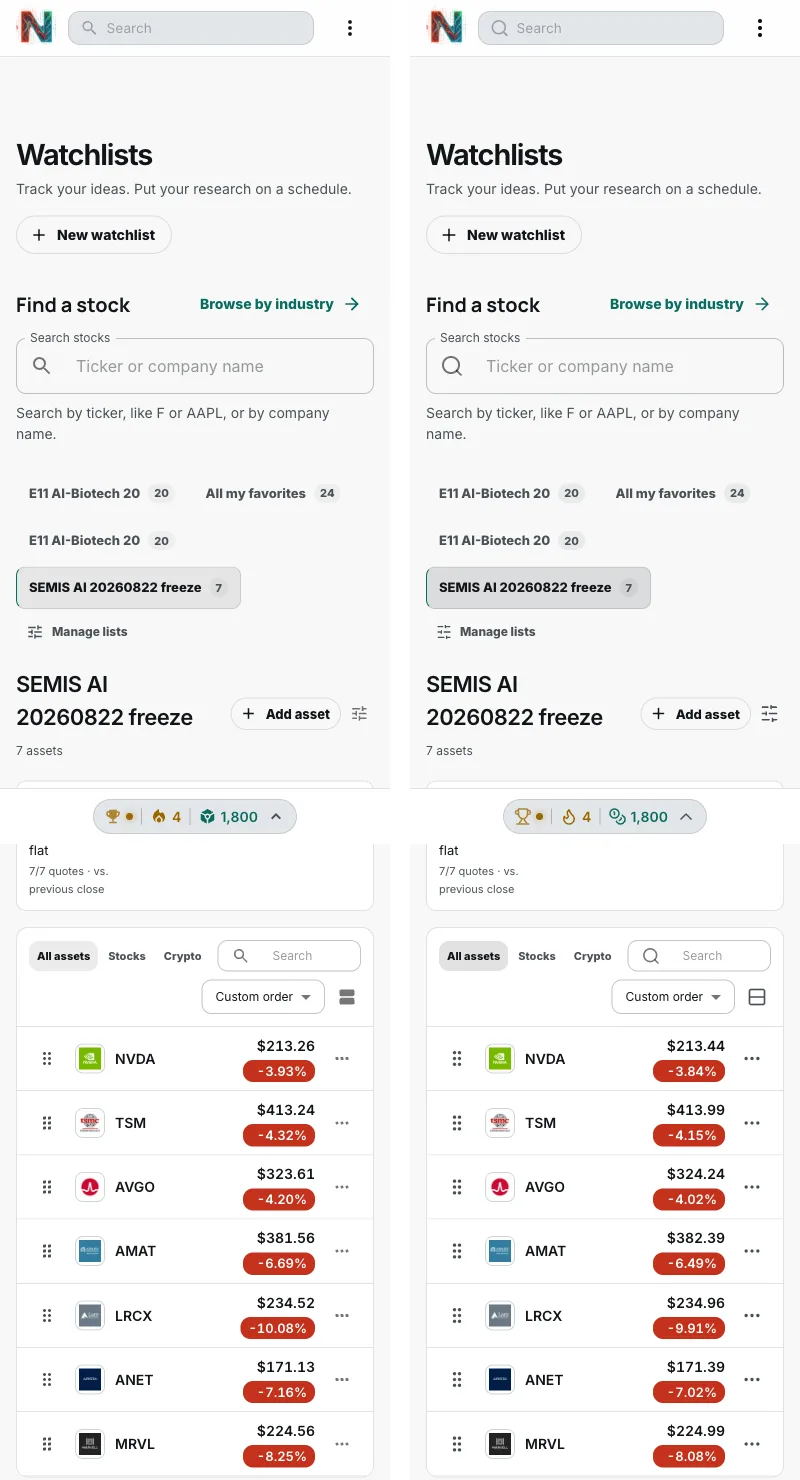
Every page was captured at 1440 px and 390 px against the same data, once on the original build and once on the migrated build, and compared pixel by pixel. I accepted a page only when its height matched exactly and fewer than 1% of pixels differed. Most of what remains is icon glyphs, because I replaced MUI's filled icons with Lucide's outlined set.
The comparison caught every layout slip below, usually as a page that came out a few pixels shorter.
MUI behaviors I had to reproduce
Compound selectors in a shared stylesheet beat component classes
A shared rule such as .chip.small outranks a component's own single class. I wrapped every modifier in :where() so each shared selector has the specificity of one class.
Container's gutter outranks sx padding
MUI emits Container's 24 px side padding at 600 px and wider as a media rule after the sx rule, so an sx px: 0 never applied there. The migrated composer had to keep the gutter MUI actually rendered.
ListItemText margins change with a second line
The margins are 4 px top and bottom, and 6 px when a secondary line is present. Copying the 4 px made every two-line chat session row shorter.
Small IconButton is sized by padding
It is 5 px of padding around the icon, so a 24 px icon makes a 34 px button. A fixed 32 px box shortened each automation row by 2 px.
Disabled styling beat sx colors
MUI's .Mui-disabled rule outranked colors set through sx. Moving a color to an inline style made disabled buttons look enabled, so runtime colors apply only while a button is enabled.
Typography always sets a weight
Text inside a semibold button stayed regular in MUI, so the replacement Text component sets the regular weight instead of inheriting it.
React escapes quotes inside a server-rendered style tag
A layout test that rendered its CSS as <style>{css}</style> turned grid-template-areas quotes into ", which the browser drops. Raw HTML injection fixed the fixture.
Keeping shared styles overridable
Show the CSS
/* Every selector has the specificity of one class, so a component's own
   class always overrides the shared primitive, the way sx did. */
.button { display: inline-flex; min-width: 64px; padding: var(--nt-button-padding-y) var(--nt-button-padding-x); }
.contained { background: var(--nt-action); color: var(--nt-action-ink); }
.contained:where(:hover:not(:disabled)) { background: var(--nt-action-hover); }
.button:where(:hover:not(:disabled)) { box-shadow: var(--nt-surface-shadow); }

/* A runtime color that still yields to the disabled look. */
.enabledColor:where(:enabled) { color: var(--enabled-color); }

/* Disabled comes last so it overrides every variant and tone. */
.button:where(:disabled) { color: rgb(var(--nt-ink-channel) / 0.26); }
How I measured
Show the frame observer
I built both versions with the production Vite build and served them against the same local database. For each page, a headless Chrome session throttled the CPU 4x, loaded the page, waited 6 seconds for data to settle, and summed every long animation frame of 50 ms or more. I report the median of three loads.
Frames triggered by data loads are long frames whose scripts were invoked from an XMLHttpRequest callback, which is where the dashboard's repeated re-renders happen.
new PerformanceObserver(list => {
  for (const entry of list.getEntries()) {
    if (entry.duration < 50) continue;
    const fromXhr = entry.scripts.some(s => /XMLHttpRequest|onloadend|onreadystatechange/i.test(s.invoker || ""));
    frames.push({ duration: entry.duration, blocking: entry.blockingDuration, fromXhr });
  }
}).observe({ type: "long-animation-frame", buffered: true });
No comments yet.