Follow the example
Choose a step to follow the example. Opening a request lets you review it; it does not submit a job or change your account.
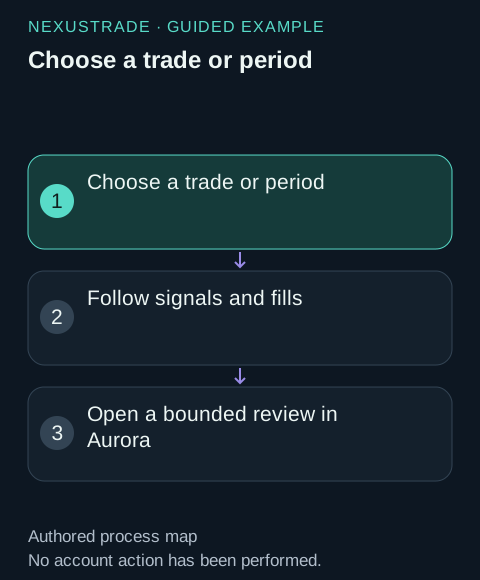
Choose a trade or period
Start with the full curve. Choose an entry, exit or drawdown period, then follow the events around its timestamp. Each strategy page includes a captured signal, Filled orders and a downloadable full history.
- BuySignal or SellSignal
- What to inspect: Condition values and the rule that fired
- Order with status Filled
- What to inspect: Pair, side, fractional units, submitted price, fill price and fee
- Portfolio history
- What to inspect: Cash, position value and total value before and after the trade
A task anchored to the same saved example and pair.
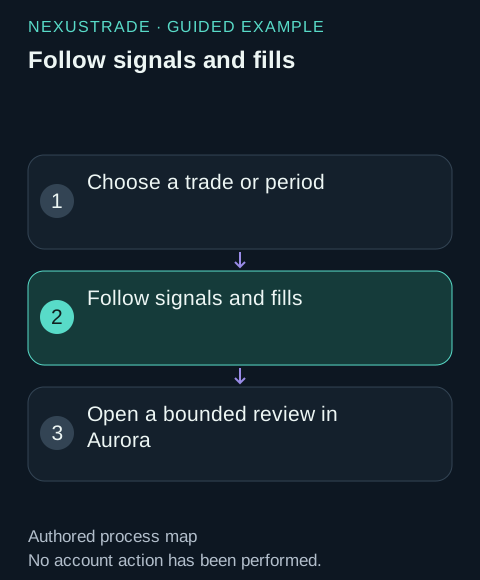
Follow signals and fills
Pending, Accepted and Filled are stages of an order. Follow the Filled events when examining executed quantities. Compare entry and exit cash flows and the remaining holdings.
Units and timestamps that explain the result, not an unexplained headline return.
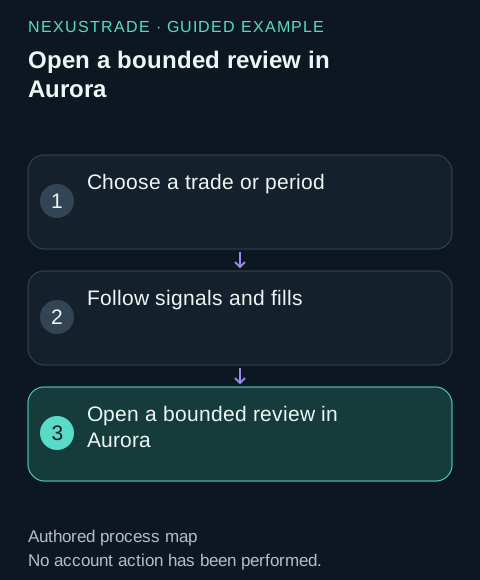
Open a bounded review in Aurora
Review your request with the exact candidate or returned test ID. Keep the full pair and all cost assumptions. Do not resubmit an already running test.
The next inspectable draft or read-only result request, with saving and execution left to explicit user action.
Choose a trade or period
Start with the full curve. Choose an entry, exit or drawdown period, then follow the events around its timestamp. Each strategy page includes a captured signal, Filled orders and a downloadable full history.
Follow signals and fills
Pending, Accepted and Filled are stages of an order. Follow the Filled events when examining executed quantities. Compare entry and exit cash flows and the remaining holdings.
| BuySignal or SellSignal | Condition values and the rule that fired |
| Order with status Filled | Pair, side, fractional units, submitted price, fill price and fee |
| Portfolio history | Cash, position value and total value before and after the trade |
No matching rows. Clear the filter to see all records.
{
  "backtest_id": "<your completed backtest ID>",
  "start_date": "2024-01-01",
  "end_date": "2024-01-07",
  "event_types": [
    "BuySignal",
    "SellSignal",
    "Order"
  ],
  "include_condition_audit": true,
  "raw": true,
  "page_size": 50,
  "page": 1
}
Explore a drawdown
Inspect holdings, cash and sale events around the peak and trough. For accumulation, also inspect purchase dates and the capital still waiting in cash. Save event excerpts during the 3-day retention period.