Follow the example
Choose a step to follow the example. Opening a request lets you review it; it does not submit a job or change your account.
Choose the information the rule needs
Technical rules use price/volume observations. Fundamental rules use company facts with a fiscal period and filing availability. Write each input explicitly.
- Revenue
- Q4 2024: 96,469 · Q4 2025: 113,828 · Unit: USD millions
- Diluted EPS
- Q4 2024: 2.15 · Q4 2025: 2.82 · Unit: USD per diluted share
Separate units, update schedules and available-at dates.
Compare complete candidate behavior
Read the worked rules below, including action, allocation and exit. Combining a value screen with an entry signal creates a new complete strategy, not a free performance improvement.
A comparable hypothesis with its own test and coverage assumptions.
Preview one mixed rule
Ask Aurora to explain the supported operands and preview a draft with unresolved fiscal/price inputs called out. Do not substitute present-day fundamentals into earlier decisions.
A reviewable condition with timing and state controls.
Choose the question before choosing the method
Fundamental analysis helps you assess the business and the price you would pay for its earnings or cash flows. Technical analysis turns observed market prices and volume into conditions for an entry, exit or position change. Use fundamentals to investigate a company; use a specified price rule when your task is to test trading behavior.
NexusTrade lets you keep those decisions visible: a company page for dated financial observations and a saved strategy for the conditions that can place orders. Combining the two requires a written rule for how they interact. A strong business result cannot substitute for that rule.
A real fundamental observation: Alphabet's fourth quarter of 2025
Alphabet published these results on February 4, 2026 for the quarter ended December 31, 2025. Its earnings release reports revenue of $113.828 billion, compared with $96.469 billion a year earlier. The increase is ($113.828 / $96.469 - 1) × 100 = 18.0%, rounded. Diluted earnings per share rose from $2.15 to $2.82.
This supports a specific conclusion: reported revenue and diluted EPS grew compared with the same quarter a year earlier. It does not establish that GOOG was cheap, that earnings would continue growing, or that an order on the publication date would have made money. Valuation still needs a dated share price, consistent earnings period and explicit assumptions.
| Revenue | 96,469 | 113,828 | USD millions |
| Diluted EPS | 2.15 | 2.82 | USD per diluted share |
No matching rows. Clear the filter to see all records.
Alphabet earnings release, February 4, 2026. Historical company results, not a current quote.
A price condition answers a different question
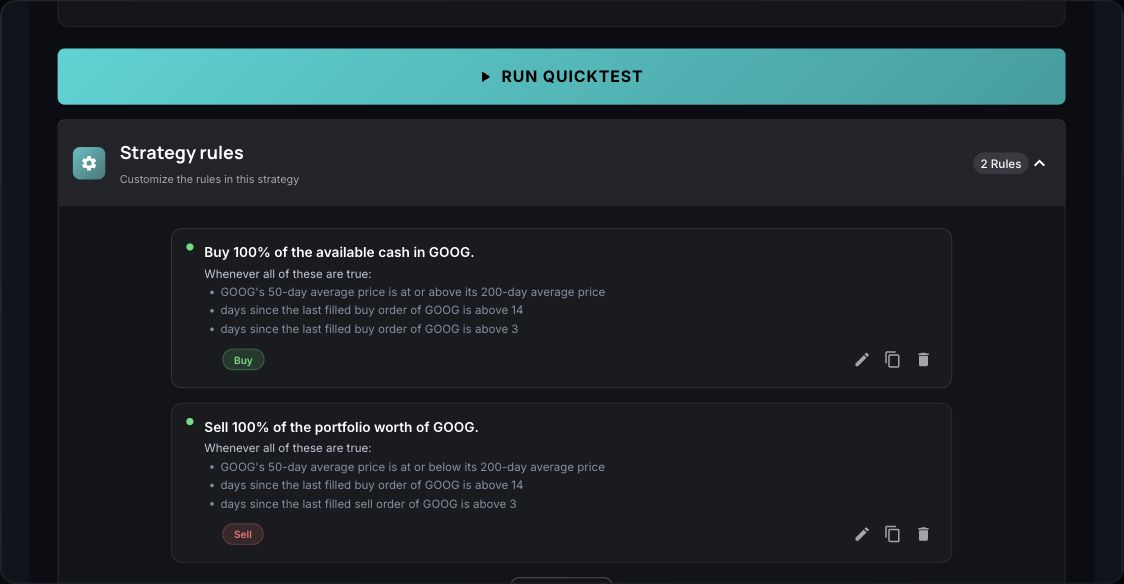
The actual Google library recipe compares its 50-day and 200-day simple moving averages. The screenshot and rule export below show the saved conditions, including cooldowns. That rule does not read the earnings release above.
For an arithmetic example, suppose the 50-day average is $160 and the 200-day average is $150. The comparison 160 >= 150 is true. These are illustrative inputs, not observed GOOG prices. A true moving-average comparison still needs the recipe's cooldown conditions before its buy rule qualifies. The same comparison can become false while the company's previously reported revenue remains unchanged.
Inspect an actual NexusTrade strategy
Buy 100% of the available cash in GOOG whenever GOOG's 50-day average price is at or above its 200-day average price and days since the last filled buy order of GOOG is above 14 and days since the last filled buy order of GOOG is above 3.
Buy GOOG 50 Day GOOG SMA ≥ 200 Day GOOG SMA and # of Days Since the Last Filled Buy Order of GOOG > Constant 14 and # of Days Since the Last Filled Buy Order of GOOG > Constant 3
Sell 100% of the portfolio worth of GOOG whenever GOOG's 50-day average price is at or below its 200-day average price and days since the last filled buy order of GOOG is above 14 and days since the last filled sell order of GOOG is above 3.
Sell 100% GOOG 50 Day GOOG SMA ≤ 200 Day GOOG SMA and # of Days Since the Last Filled Buy Order of GOOG > Constant 14 and # of Days Since the Last Filled Sell Order of GOOG > Constant 3
What the saved rules mean
The buy rule checks whether the 50-day moving average is at least the 200-day average, with more than 14 days since the last buy and an additional more-than-3-day buy check. The sell rule checks the inverse state, with more than 14 days since the last buy and more than 3 days since the last sell. These are state checks with cooldowns. They do not require a new crossing event.
The JSON below retains the library conditions and actions while omitting editor forms, generated identifiers and timestamps. It is a semantic export for inspection, not a saved customer portfolio.
The buy spends 100% of buying power; the sell uses 100% of portfolio value. Equality meets both moving-average comparisons. There is no explicit zero-position entry guard. Review those details before changing the recipe or translating it to another engine.
View complete record
[
  {
    "name": "Buy 100% of the available cash in GOOG whenever GOOG's 50-day average price is at or above its 200-day average price and days since the last filled buy order of GOOG is above 14 and days since the last filled buy order of GOOG is above 3.",
    "userId": null,
    "active": true,
    "condition": {
      "name": "50 Day GOOG SMA ≥ 200 Day GOOG SMA and # of Days Since the Last Filled Buy Order of GOOG > Constant 14 and # of Days Since the Last Filled Buy Order of GOOG > Constant 3",
      "type": "And",
      "description": "All conditions must be true",
      "example": "If Apple's price is up today but down for the week.",
      "conditions": [
        {
          "lhs": {
            "compound": false,
            "targetAsset": {
              "name": "GOOG",
              "type": "Stock",
              "symbol": "GOOG"
            },
            "targetAssets": [],
            "window": {
              "length": 50,
              "interval": "Day"
            },
            "type": "SimpleMovingAverage",
            "name": "50 Day GOOG SMA"
          },
          "rhs": {
            "compound": false,
            "targetAsset": {
              "name": "GOOG",
              "type": "Stock",
              "symbol": "GOOG"
            },
            "targetAssets": [],
            "window": {
              "length": 200,
              "interval": "Day"
            },
            "type": "SimpleMovingAverage",
            "name": "200 Day GOOG SMA"
          },
          "name": "50 Day GOOG SMA ≥ 200 Day GOOG SMA",
          "comparison": "greaterThanOrEqual",
          "type": "Base",
          "description": "Left-Hand indicator (comparator) Right-Hand Indicator",
          "example": "If the Rate of Change of Apple's price is > the Value 0."
        },
        {
          "lhs": {
            "compound": false,
            "targetAssets": [
              {
                "name": "GOOG",
                "type": "Stock",
                "symbol": "GOOG"
              }
            ],
            "side": "Buy",
            "type": "DaysSinceOrder",
            "orderStatus": "Filled",
            "name": "# of Days Since the Last Filled Buy Order of GOOG"
          },
          "rhs": {
            "compound": false,
            "targetAssets": [],
            "value": 14,
            "type": "Value",
            "name": "Constant 14"
          },
          "name": "# of Days Since the Last Filled Buy Order of GOOG > Constant 14",
          "comparison": "greaterThan",
          "type": "Base",
          "description": "Left-Hand indicator (comparator) Right-Hand Indicator",
          "example": "If the Rate of Change of Apple's price is > the Value 0."
        },
        {
          "lhs": {
            "compound": false,
            "targetAssets": [
              {
                "name": "GOOG",
                "type": "Stock",
                "symbol": "GOOG"
              }
            ],
            "side": "Buy",
            "type": "DaysSinceOrder",
            "orderStatus": "Filled",
            "name": "# of Days Since the Last Filled Buy Order of GOOG"
          },
          "rhs": {
            "compound": false,
            "targetAssets": [],
            "value": 3,
            "type": "Value",
            "name": "Constant 3"
          },
          "name": "# of Days Since the Last Filled Buy Order of GOOG > Constant 3",
          "comparison": "greaterThan",
          "type": "Base",
          "description": "Left-Hand indicator (comparator) Right-Hand Indicator",
          "example": "If the Rate of Change of Apple's price is > the Value 0."
        }
      ]
    },
    "action": {
      "type": "Buy",
      "targetAsset": {
        "name": "GOOG",
        "type": "Stock",
        "symbol": "GOOG"
      },
      "amount": {
        "type": "percent of buying power",
        "amount": 100
      }
    },
    "orderExecution": {
      "type": "Market"
    },
    "automaticOrderApproval": false
  },
  {
    "name": "Sell 100% of the portfolio worth of GOOG whenever GOOG's 50-day average price is at or below its 200-day average price and days since the last filled buy order of GOOG is above 14 and days since the last filled sell order of GOOG is above 3.",
    "userId": null,
    "active": true,
    "condition": {
      "name": "50 Day GOOG SMA ≤ 200 Day GOOG SMA and # of Days Since the Last Filled Buy Order of GOOG > Constant 14 and # of Days Since the Last Filled Sell Order of GOOG > Constant 3",
      "type": "And",
      "description": "All conditions must be true",
      "example": "If Apple's price is up today but down for the week.",
      "conditions": [
        {
          "lhs": {
            "compound": false,
            "targetAsset": {
              "name": "GOOG",
              "type": "Stock",
              "symbol": "GOOG"
            },
            "targetAssets": [],
            "window": {
              "length": 50,
              "interval": "Day"
            },
            "type": "SimpleMovingAverage",
            "name": "50 Day GOOG SMA"
          },
          "rhs": {
            "compound": false,
            "targetAsset": {
              "name": "GOOG",
              "type": "Stock",
              "symbol": "GOOG"
            },
            "targetAssets": [],
            "window": {
              "length": 200,
              "interval": "Day"
            },
            "type": "SimpleMovingAverage",
            "name": "200 Day GOOG SMA"
          },
          "name": "50 Day GOOG SMA ≤ 200 Day GOOG SMA",
          "comparison": "lessThanOrEqual",
          "type": "Base",
          "description": "Left-Hand indicator (comparator) Right-Hand Indicator",
          "example": "If the Rate of Change of Apple's price is > the Value 0."
        },
        {
          "lhs": {
            "compound": false,
            "targetAssets": [
              {
                "name": "GOOG",
                "type": "Stock",
                "symbol": "GOOG"
              }
            ],
            "side": "Buy",
            "type": "DaysSinceOrder",
            "orderStatus": "Filled",
            "name": "# of Days Since the Last Filled Buy Order of GOOG"
          },
          "rhs": {
            "compound": false,
            "targetAssets": [],
            "value": 14,
            "type": "Value",
            "name": "Constant 14"
          },
          "name": "# of Days Since the Last Filled Buy Order of GOOG > Constant 14",
          "comparison": "greaterThan",
          "type": "Base",
          "description": "Left-Hand indicator (comparator) Right-Hand Indicator",
          "example": "If the Rate of Change of Apple's price is > the Value 0."
        },
        {
          "lhs": {
            "compound": false,
            "targetAssets": [
              {
                "name": "GOOG",
                "type": "Stock",
                "symbol": "GOOG"
              }
            ],
            "side": "Sell",
            "type": "DaysSinceOrder",
            "orderStatus": "Filled",
            "name": "# of Days Since the Last Filled Sell Order of GOOG"
          },
          "rhs": {
            "compound": false,
            "targetAssets": [],
            "value": 3,
            "type": "Value",
            "name": "Constant 3"
          },
          "name": "# of Days Since the Last Filled Sell Order of GOOG > Constant 3",
          "comparison": "greaterThan",
          "type": "Base",
          "description": "Left-Hand indicator (comparator) Right-Hand Indicator",
          "example": "If the Rate of Change of Apple's price is > the Value 0."
        }
      ]
    },
    "action": {
      "type": "Sell",
      "targetAsset": {
        "name": "GOOG",
        "type": "Stock",
        "symbol": "GOOG"
      },
      "amount": {
        "type": "percent of portfolio",
        "amount": 100
      }
    },
    "orderExecution": {
      "type": "Market"
    },
    "automaticOrderApproval": false
  }
]
Work through the decision in NexusTrade
1. Read the company page
Open GOOG fundamentals below. Record each metric's financial period and the market snapshot date; distinguish quarterly results from trailing annual ratios.
2. Check the primary source
For the historical example, open the February 4 release and verify the revenue row, units and fiscal period. Keep that date with the conclusion.
3. Inspect the actual recipe
Open the exact Google library recipe. Read both rule cards, comparison operators, day checks and sizing. Decide whether you want this recipe or a new candidate with different rules.
4. Keep a combined rule explicit
If you want fundamentals to filter an entry, name the metric, financial period and threshold in the candidate. Review the returned condition before saving. Do not silently treat this historical release as data available in earlier years.
How to test a combined hypothesis
Freeze the universe, dates, starting capital, entry and exit rules, allocation, fees and execution assumptions. Compare the price-only candidate with an otherwise identical candidate that includes the fundamental filter. Preserve the rejected trades and missing-data counts as well as returns.
A December 31 fiscal period is not a December 31 public release. This example became public on February 4. A historical test that uses it earlier has look-ahead bias. If the data path cannot establish when a fundamental observation became available, do not describe the result as a point-in-time test.
If no orders appear, first check whether both inputs existed, whether the averages had enough history and whether the conjunction ever became true. A missing financial observation is not a zero. This page supplies a worked analysis and actual saved rules; it does not report a matched performance winner.