TL;DR
Tickeron's published robot headline is 64% annualized, while its $4,581 closed-trade profit on $100,000 equals 4.581% over the stated 31 days. Open positions and other equity adjustments remain unresolved. NexusTrade's separate two-session SPY call example ended at $9,750.77 with its option still held. Those different instruments, dates and profit definitions cannot rank performance. Choose between inspecting a supplied robot's logs and preserving your own editable rule, then compare complete paths under matched assumptions.
Follow one completed NexusTrade option entry from rule to fill
Portfolio value (USD)
- One SPY long call, remaining capital in cash 2024-01-03, 20:00:00 EST
- $9,750.77
- Full-capital native SPY comparator 2024-01-03, 20:00:00 EST
- $9,853.88
One SPY long call, remaining capital in cash: 2.55% largest decline in plotted observations. 2024-01-02, 12:00:00 EST ($10,005.27) to 2024-01-03, 16:00:00 EST ($9,750.27).
Show the table · 9 rows, 2 columns
Scroll sideways to compare all columns. Select a heading to sort.
| Requested history | January 2 to January 3, 2024; Minute evaluation |
| Editable rule | SPY price > SMA50(Day), with zero matching long calls; $1,000 premium budget. |
| Decision | January 2 at 09:31 EST; SPY $472.53 > SMA $461.57; matching count 0. |
| Selected contract | SPY240202C00472500; $472.50 strike, February 2 expiry, 31 DTE. |
| Simulated fill | One call at 09:32 EST; $8.235833 per share × 100, plus $0.65 commission. |
| Ending state | $9,750.7667 NAV; $9,175.7667 cash and $575 call value. Zero closed trades. |
| Reported return / maximum drawdown | -2.49% / 2.93%, including the held position. |
| Native pricing counters | Contract 8: one observed-quote pricing, zero synthetic; 27 unknown-price checks. |
| Quote admission | Native warning remains: coverage is not certified for strategy comparison. |
No matching rows. Clear the filter to see all records.
A new native MCP historical run captured October 13, 2026. Claude Code subsequently read the completed receipt. Thirty-four recorded history observations include extended hours; they are not every Minute evaluation.
The completed examples guide retains the request, rule, entry decision and recorded curve. This option position remained open at the end. Its return includes that mark, whereas the Tickeron field above concerns closed trades on three other instruments. Those figures are not a matched performance comparison.
The entry consumed $824.233333 including commission, leaving $9,175.766667 cash. The selected-candidate quote belongs to the decision time; the fill happened one minute later and includes the model's pricing and liquidity adjustments. Keep those clocks distinct when inspecting the premium.
A 64% annualized headline and $4,581 closed profit answer different questions
Show the table · 6 rows, 3 columns
Scroll sideways to compare all columns. Select a heading to sort.
| Instruments | XAR, ITA, SOXL | Three instruments, including a leveraged ETF. |
| Cycle and observation length | 15 minutes; 31 days | Retain the exact dated interval before comparing paths. |
| Annualized return | +64% | A normalized headline, not the realized percentage over 31 days. |
| Initial balance and closed-trades P/L | $100,000; $4,581 | Closed profit divided by initial balance = 4.581%. |
| Position sizes | $13,200, $9,900 and $3,000 | Preserve sizing when interpreting returns. |
| Full equity-path calculation | Not supplied by these excerpted fields | Open-position marks, cash flows, costs and timestamps are needed to reconcile total return. |
No matching rows. Clear the filter to see all records.
Tickeron's October 2025 vendor report, read October 13, 2026. The arithmetic uses its stated figures. It is a review of a published claim, not our execution of the robot.
The Tickeron report identifies these figures as backtested data. Dividing $4,581 by $100,000 gives 4.581% closed-trades profit relative to starting capital. That calculation leaves open positions and other equity adjustments unresolved; it does not reconstruct the reported annualization formula.
To evaluate this robot, retain its identifier, exact start/end timestamps, equity curve and trade log. Reconcile realized and unrealized results before comparing it with a strategy on different instruments or capital.
Tickeron supplies robots, signals and historical logs to inspect
Tickeron's backtesting FAQ describes built-in robot backtests based on historical trade logs, using a 60-minute SPY robot in different market regimes as its example.
Its iPhone listing describes stock watchlists, technical signals, alerts and selecting AI Robots. The practical first task is choosing a robot and inspecting its stated logic, history and current signals.
The NexusTrade worked example starts with an editable strategy condition and action, then a specified historical request. Its marketplace also supplies existing portfolios to inspect and copy to paper. For either workflow, retain the strategy or robot identity and the result you are evaluating. Check the selected Tickeron product and plan for its exact customization and export access.
Show the table · 3 rows, 2 columns
| Your next action | What to retain |
|---|---|
| Inspect a Tickeron robot | Its product/model identity, signal or virtual/brokerage mode, trade logs, dates, sizing and open positions. |
| Reproduce a NexusTrade rule | Editable condition/action JSON, execution cadence, capital, fees, dates and completed run evidence. |
| Compare the two | A common instrument universe and evaluation interval, consistent capital/exposure and comparable execution assumptions. |
No matching rows. Clear the filter to see all records.
Change one rule with a visible before and after
The saved call recipe exits when the SPY trend breaks or a held option reaches 14 days to expiry. To investigate a seven-day exit, preserve the original and change only that expiry threshold. Keep the entry, budget, window, cadence, costs and comparator fixed.
Inspect the new exit timestamp and premium before interpreting its portfolio return. The two-session example never reached either expiry threshold, so changing 14 to 7 would not itself demonstrate an earlier exit in that window. Choose a period that actually contains the event being investigated, then record that choice as development evidence.
{
  "originalCloseTrigger": {
    "type": "dte",
    "maxDte": 14
  },
  "proposedSingleChange": {
    "type": "dte",
    "maxDte": 7
  }
}Compare complete paths under a frozen protocol
The robot report and the call example show different kinds of inspectable evidence. A performance verdict requires the matching protocol above. This resource compares the research tasks and evidence you can request; it does not report a same-period competition between the products.
Show the table · 6 rows, 2 columns
| Protocol field | Decision to freeze before testing |
|---|---|
| Model identity | Retain the exact supplied robot version or authored strategy snapshot. |
| Dates and selection | Declare development periods and a later untouched evaluation before selecting a winner. |
| Capital and exposure | Match instrument universe, leverage, allocation, idle cash and any deposits. |
| Execution | Retain decision/fill clocks, session hours, quote timing, slippage and commissions. |
| Result | Measure full NAV, benchmark path, drawdowns, open holdings and closed-trade cash flows. |
| Next stage | Keep historical simulation, later paper observation and broker execution as separate records. |
No matching rows. Clear the filter to see all records.
Discover a strategy or inspect your own rule
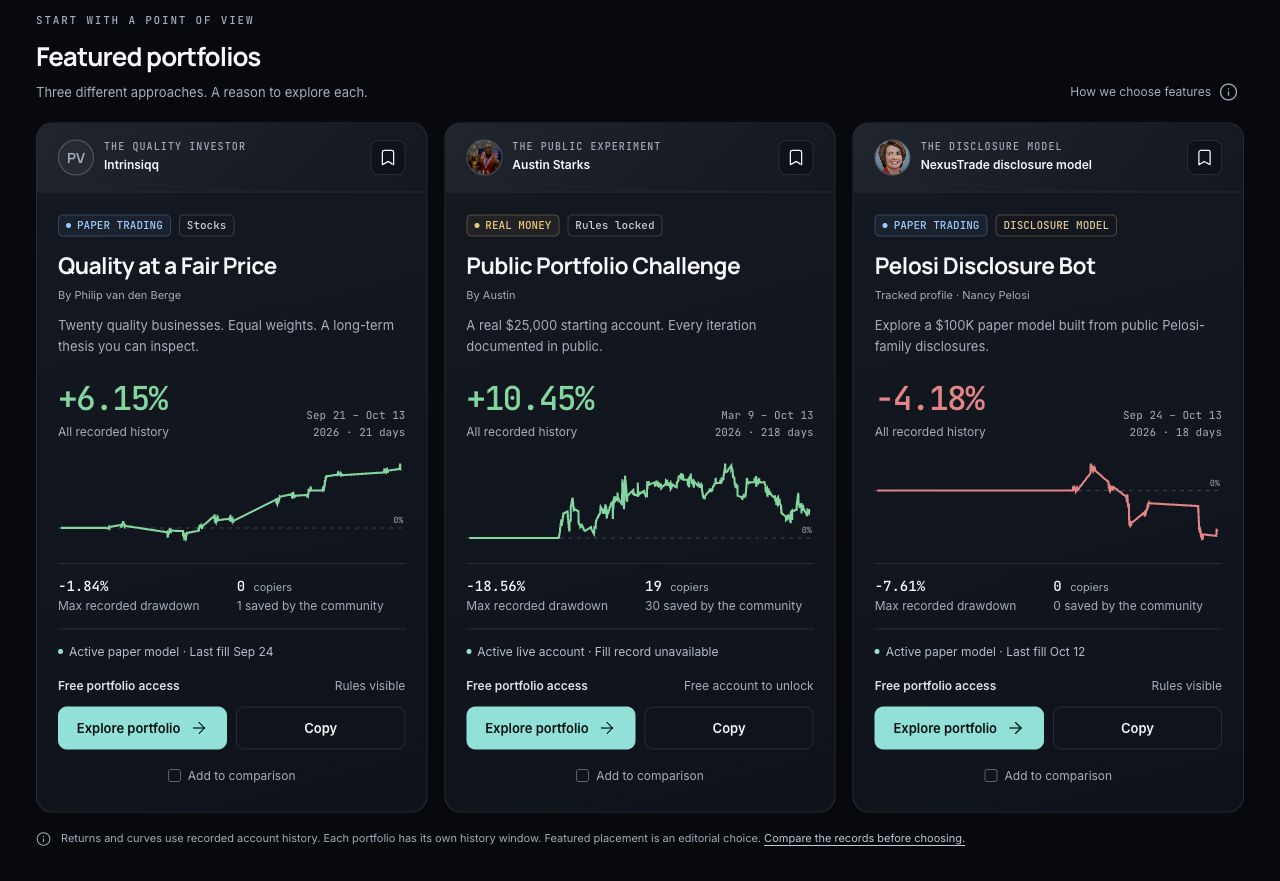
You can also start with an existing strategy in NexusTrade. Its marketplace supports searching and filtering portfolios, comparing their displayed results and copying a strategy to paper. The native condition tree lets you inspect saved rules, and the visual builder edits them. Choosing a supplied model is therefore a workflow to compare in both products; Tickeron's vendor report alone does not establish an exclusive discovery or tracking advantage.
Choose the artifact you want to produce
Inspect the request
Tickeron's documented workflow fits inspecting supplied AI Robots, following their signals and reviewing their logs. NexusTrade's demonstrated workflow fits authoring a precise rule, specifying the historical run, inspecting orders and preserving an editable research record.
Open the completed NexusTrade examples and follow the exact option entry before changing its rule. For Tickeron, inspect the selected robot's current stats and log access with the product identity and plan you intend to use.
No comments yet.