Can rotating across assets improve the trade-off?
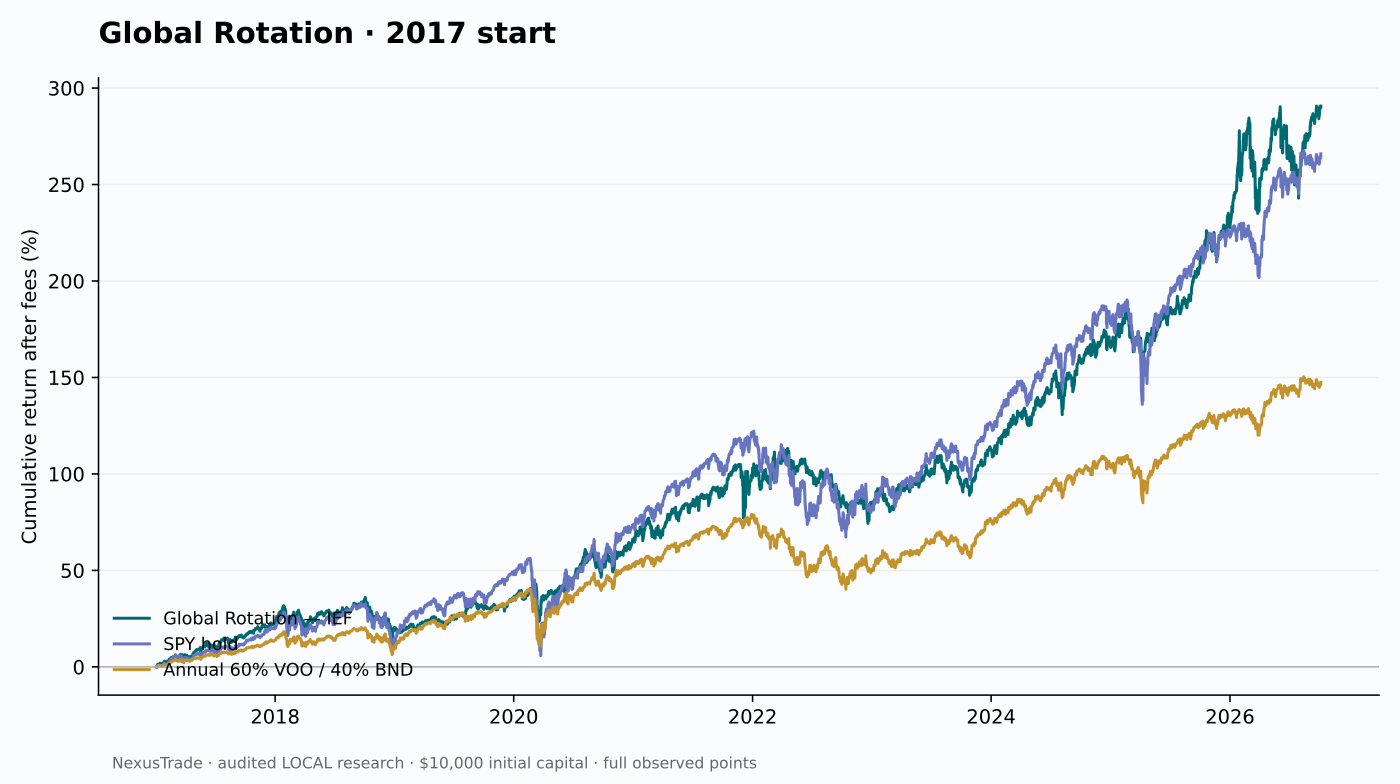
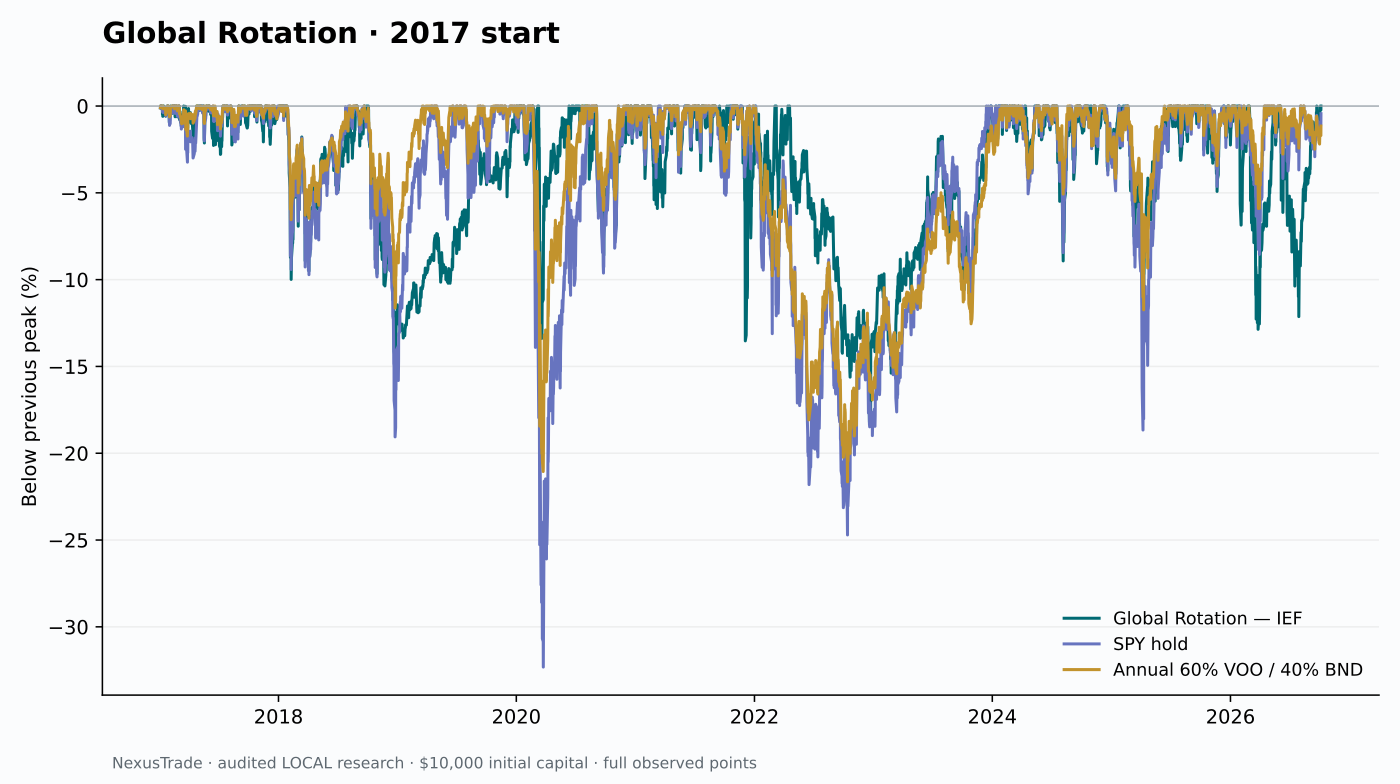
Randy Harris's Global Rotation ranks seven ETFs by momentum and allocates to three slots. We tested the public calculator's zero-hurdle configuration with IEF as the defensive destination. From January 3, 2017 through October 5, 2026, the local replay returned 290.68% after modeled fees, versus 265.90% for SPY hold. Its maximum observed drawdown was 18.21%, versus SPY's 32.32%.
The rotation also beat SPY's cumulative return in the January 2022 and January 2025 starts. It was still exposed to losses: its broad-window drawdown ran from April to December 2022, and its worst monthly interval was March 2026. Diversification and momentum reduced damage across these dates; neither made the portfolio safe.
These are audited local historical simulations, not native engine backtests or realized paper returns. The linked editable portfolio is an inactive finite historical research snapshot. Harris has not endorsed our implementation.
The broad comparison: 2017 start
Choose the lines to compare
Cumulative return (%)
Use the line buttons to compare the strategy with its recorded controls. Then switch to drawdown to inspect the losses behind the return.
- First recorded mark
- Jan 3, 2017 · 09:30:00 NY
- Last recorded mark
- Oct 5, 2026 · 16:00:00 NY
- Vertical axis range (percent)
- -0.10 to 290.68
The original ended at $39,067.54 versus SPY's $36,590.11 and the annual balanced control's $24,745.53. Its broad CAGR was 15.00%, compared with SPY's 14.23%. Rotation cost $985.15 across 419 fills, far more than the passive control's initial entry fee.
Choose the lines to compare
Below the prior peak (%)
Choose the lines whose losses you want to compare. Hiding a line changes this view only; the recorded dates and chart scale stay fixed.
- First recorded mark
- Jan 3, 2017 · 09:30:00 NY
- Last recorded mark
- Oct 5, 2026 · 16:00:00 NY
- Vertical axis range (percent)
- -32.32 to 0.00
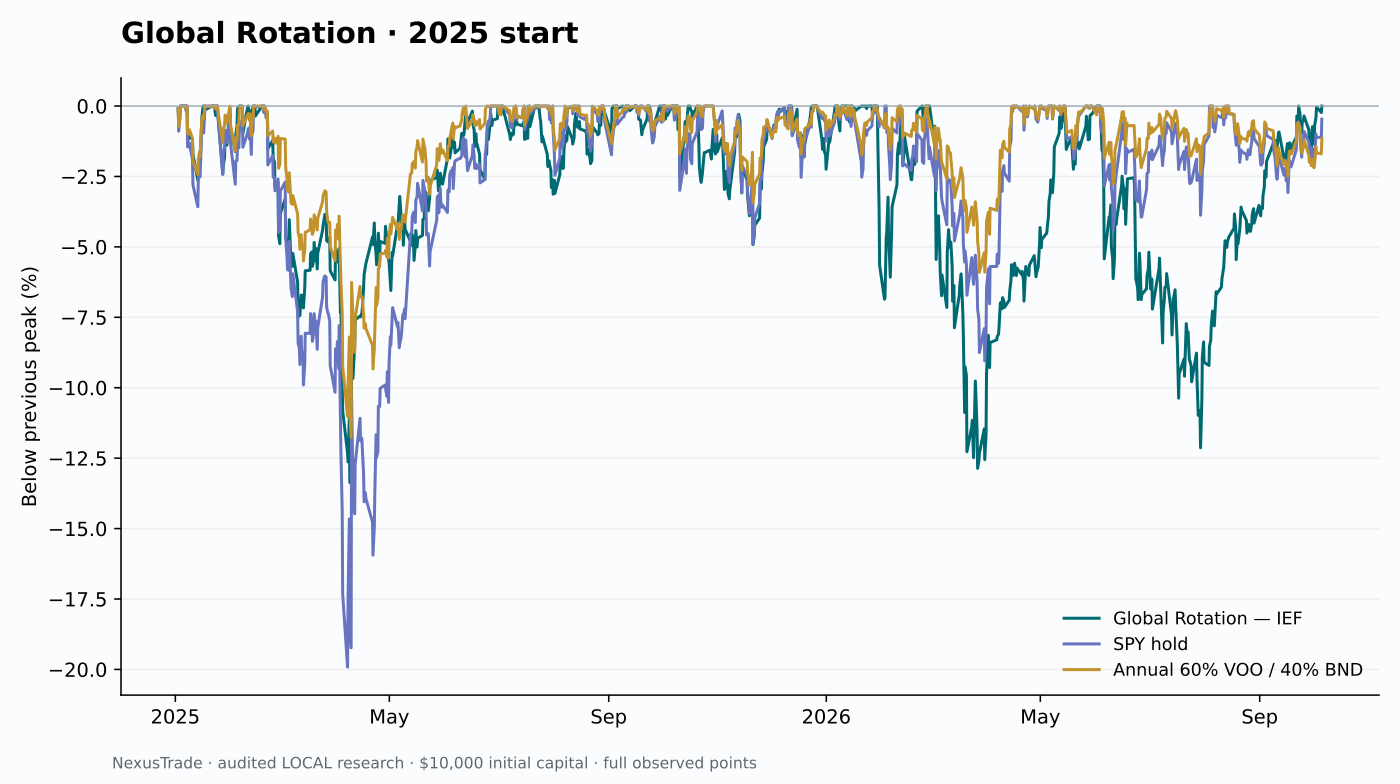
Zero is a prior high; -10 means 10% below that book’s prior peak. Compare losses over the same recorded window; these marks do not measure every intraday extreme.
What the losing events taught us
The worst retained monthly interval ran from March 2 to April 1, 2026: -7.09%. The strategy held one-third each in SGOL, VPL and VXUS. Gold's marked loss was $1,402.26, Pacific equities lost $698.30 and VXUS lost $590.84 after $12.10 of paid income. All three selected assets fell together; ranking recent winners did not provide diversification during that month.
The 2022 IEF losses motivated one frozen comparison: replace only the defensive destination with BIL. This was our event-led research change, not a new claim about Harris's recommendation. BIL reduced broad drawdown from 18.21% to 16.43%, but reduced cumulative return from 290.68% to 287.15%. The January 2022 start improved modestly; the recent book was identical because its allocations did not use defense. We retained the original rather than choose an all-period winner that did not exist.
Scroll sideways to compare all columns. Select a heading to sort.
| 2017 | 290.68% / 18.21% | 287.15% / 16.43% |
| 2022 | 92.02% / 18.21% | 93.46% / 15.06% |
| 2025 | 46.02% / 13.36% | 46.02% / 13.36% |
No matching rows. Clear the filter to see all records.
One retained defense change; no parameter menu or further trials. Original nine-book audit and separate variant diagnosis have different evidence scope.
Matched broad, stress-start and recent comparisons
Every arm begins with $10,000 on the same actual opening, ends at the October 5, 2026 closing, uses fractional shares, includes 0.1% per filled notional and keeps a 1.5% reserve. The balanced control is 60% VOO and 40% BND, rebalanced each January. Its bond exposure and annual cadence are a named comparison, not the author's rotation rule.
The 2022 start covers nearly five years, not just calendar 2022. The three overlapping windows are retrospective development evidence, not three independent holdout tests. The broad start follows actual PDBC coverage and a complete momentum warmup; it excludes the financial crisis.
Scroll sideways to compare all columns. Select a heading to sort.
| 2017-01-03 | Global Rotation — IEF | 290.68% | 18.21% | $985.15 |
| 2017-01-03 | SPY hold | 265.90% | 32.32% | $9.85 |
| 2017-01-03 | Annual 60% VOO / 40% BND | 147.46% | 21.64% | $20.50 |
| 2022-01-03 | Global Rotation — IEF | 92.02% | 18.21% | $315.24 |
| 2022-01-03 | SPY hold | 68.05% | 26.15% | $9.85 |
| 2022-01-03 | Annual 60% VOO / 40% BND | 38.57% | 21.56% | $12.84 |
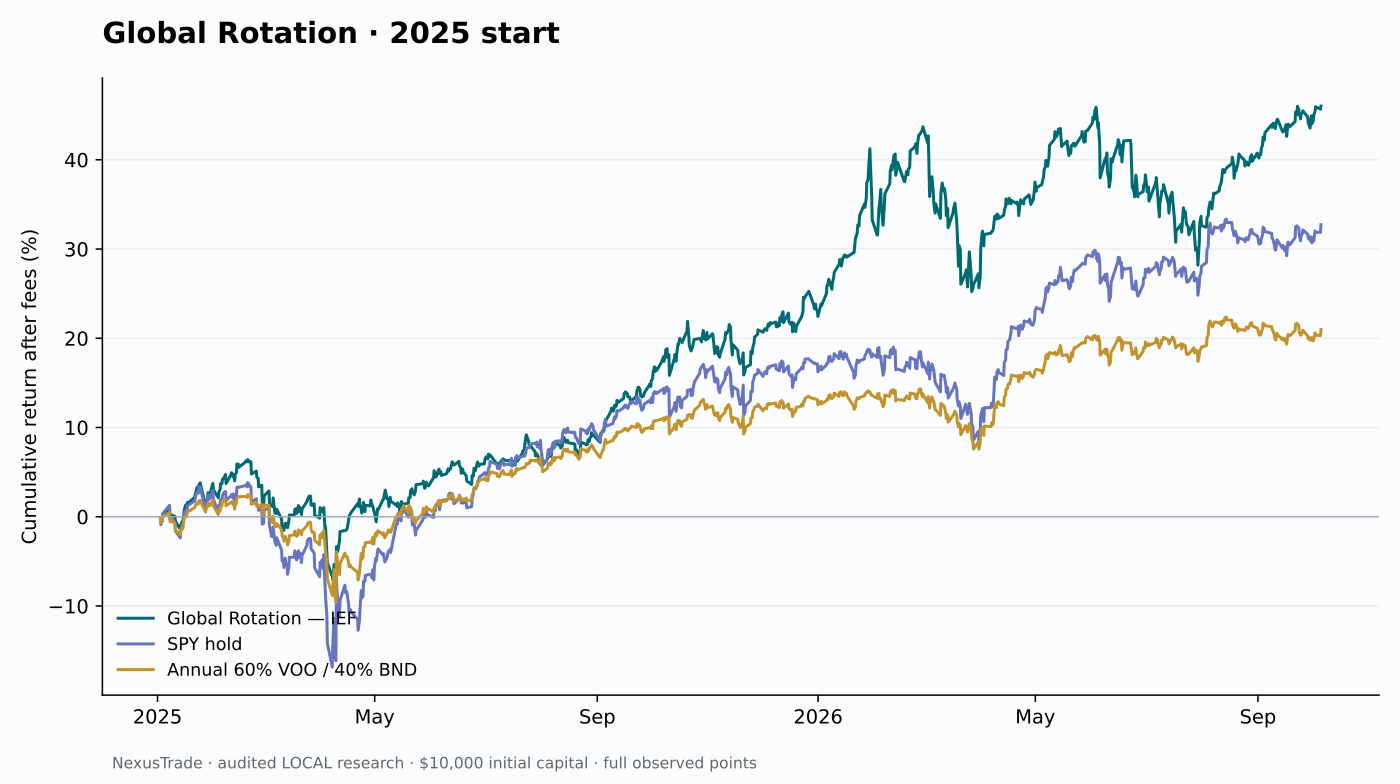
| 2025-01-02 | Global Rotation — IEF | 46.02% | 13.36% | $136.81 |
| 2025-01-02 | SPY hold | 32.73% | 19.92% | $9.85 |
| 2025-01-02 | Annual 60% VOO / 40% BND | 20.97% | 11.75% | $10.46 |
No matching rows. Clear the filter to see all records.
Cumulative net return and full observed opening/closing drawdown. The recent balanced control had less drawdown than rotation. Exact unrounded measurements and CAGR are in the downloads; a BIL-relative Sharpe was calculated internally but not independently approved by the retained audit and is excluded here.
The exact source configuration
Zero is a setting offered by the source calculator. Its default instead uses a hardcoded BOXX hurdle. We did not invent pre-inception BOXX prices, use a BIL hurdle or reproduce the author's default long-history statistics. The author's monthly Tiingo total-return marks and reconstructed pre-inception history also differ from our actual ETF opening/closing observations.
Scroll sideways to compare all columns. Select a heading to sort.
| Universe, in source tie order | VOO, VXUS, SGOL, PDBC, TLT, QQQ, VPL |
| Momentum | Equal average of 1-, 3-, 6- and 12-month cumulative total returns at completed month ends |
| Selection | Rank three assets; one-third per selected slot |
| Absolute hurdle | Strictly greater than zero; a failed slot goes to IEF, including exact equality |
| Duplicate defense slots | Aggregate their one-third allocations into IEF |
| Rebalance | Monthly, back to the target weights |
| Execution translation | Signal available at 21:00 New York after the completed month-end; trade the next actual session opening at 09:30 |
No matching rows. Clear the filter to see all records.
Defense can lose money too
Choose the lines to compare
Cumulative return (%)
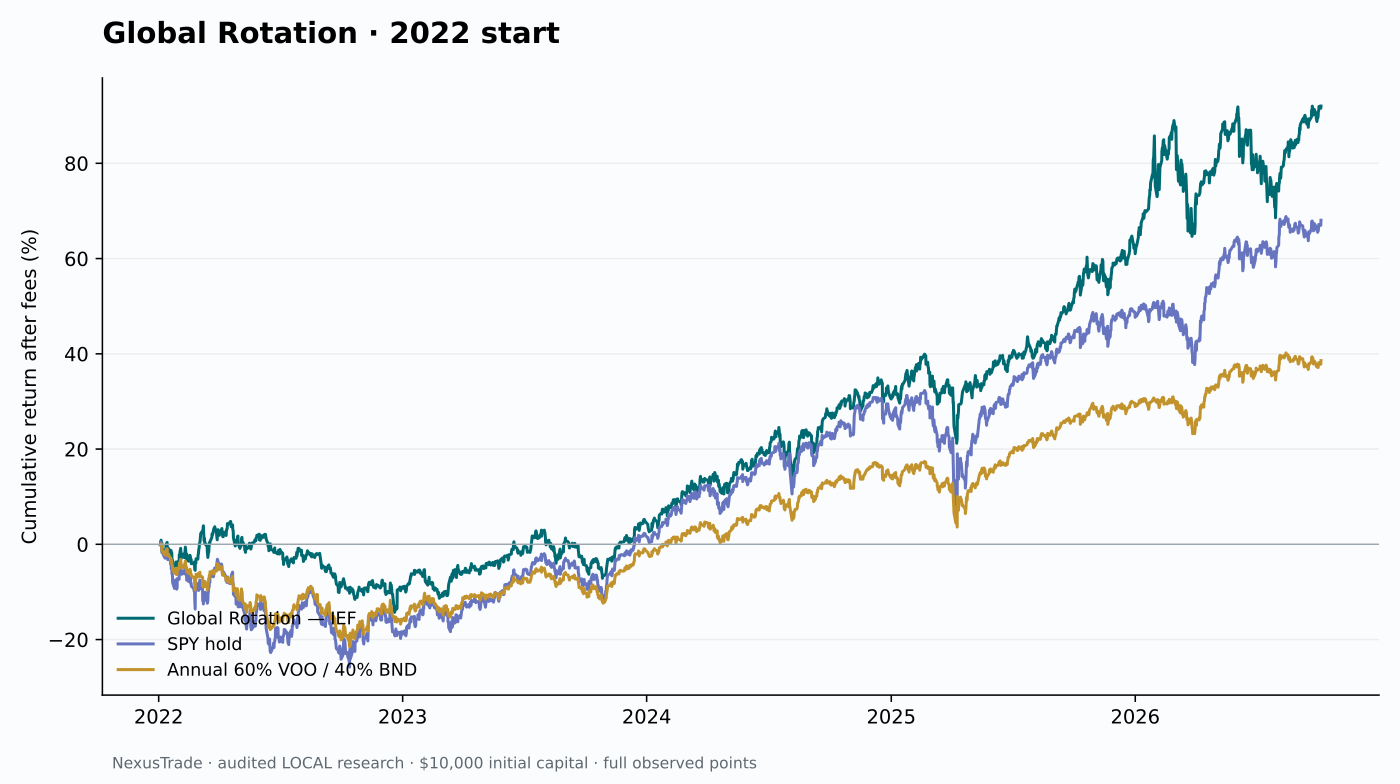
Use the line buttons to compare the strategy with its recorded controls. Then switch to drawdown to inspect the losses behind the return.
- First recorded mark
- Jan 3, 2022 · 09:30:00 NY
- Last recorded mark
- Oct 5, 2026 · 16:00:00 NY
- Vertical axis range (percent)
- -25.77 to 92.02
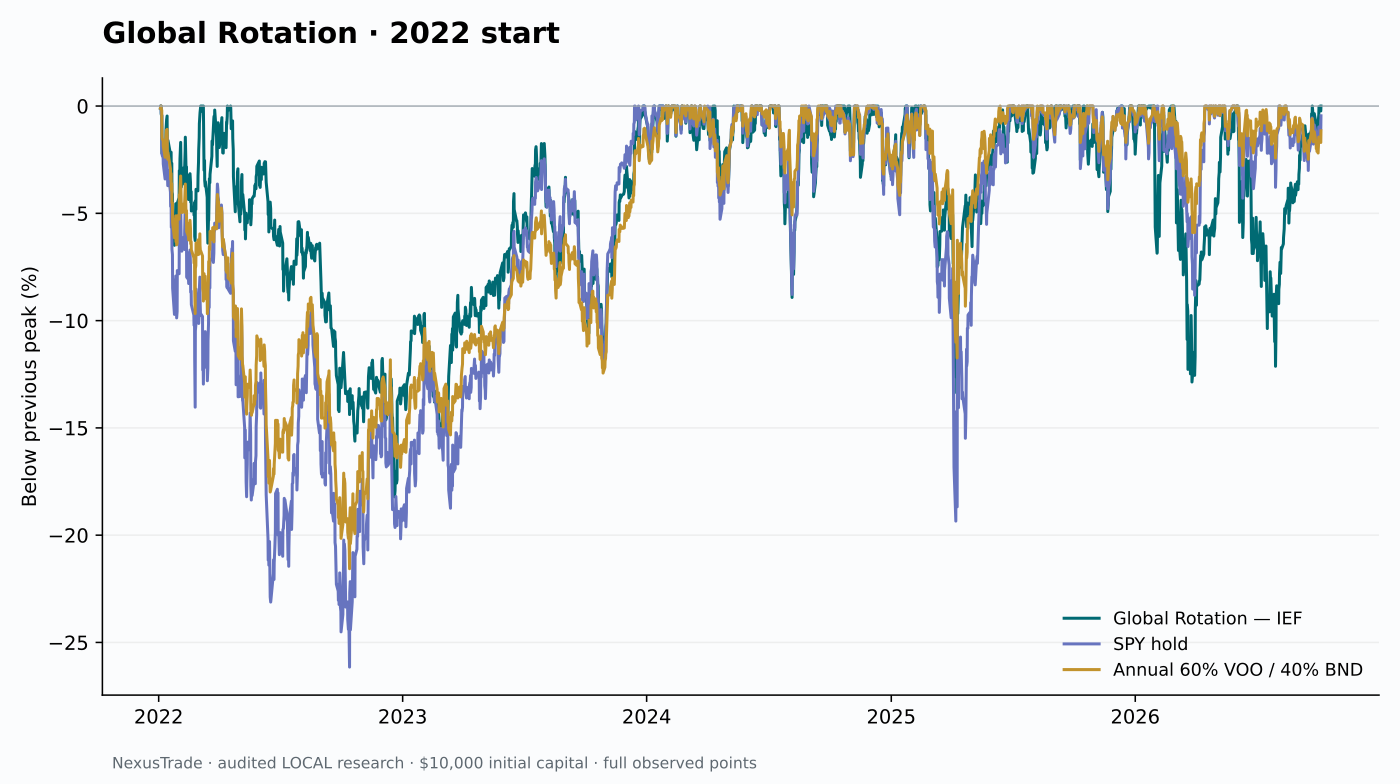
The broad-start original lost 8.82% in calendar 2022. IEF remained the destination of failed offensive slots even when its own momentum was negative. The January 2022-start book fell 18.21% from its April peak to December trough and did not recover that peak until December 2023.
Choose the lines to compare
Below the prior peak (%)
Choose the lines whose losses you want to compare. Hiding a line changes this view only; the recorded dates and chart scale stay fixed.
- First recorded mark
- Jan 3, 2022 · 09:30:00 NY
- Last recorded mark
- Oct 5, 2026 · 16:00:00 NY
- Vertical axis range (percent)
- -26.15 to 0.00
Zero is a prior high; -10 means 10% below that book’s prior peak. Compare losses over the same recorded window; these marks do not measure every intraday extreme.
The recent comparison includes a shared decline
Choose the lines to compare
Cumulative return (%)
Use the line buttons to compare the strategy with its recorded controls. Then switch to drawdown to inspect the losses behind the return.
- First recorded mark
- Jan 2, 2025 · 09:30:00 NY
- Last recorded mark
- Oct 5, 2026 · 16:00:00 NY
- Vertical axis range (percent)
- -16.84 to 46.02
Rotation returned 46.02%, ahead of SPY's 32.73%. Its 13.36% drawdown was smaller than SPY's 19.92%, but larger than the balanced control's 11.75%. A stronger return does not mean it won every risk comparison.
Choose the lines to compare
Below the prior peak (%)
Choose the lines whose losses you want to compare. Hiding a line changes this view only; the recorded dates and chart scale stay fixed.
- First recorded mark
- Jan 2, 2025 · 09:30:00 NY
- Last recorded mark
- Oct 5, 2026 · 16:00:00 NY
- Vertical axis range (percent)
- -19.92 to 0.00
Zero is a prior high; -10 means 10% below that book’s prior peak. Compare losses over the same recorded window; these marks do not measure every intraday extreme.
Cash, data and product limits
Momentum follows reinvested dividends from the ex-date. Portfolio cash waits for payment and the next scheduled allocation, so those two histories use different clocks.
The independent saved-data audit verified 118 monthly targets and the nine original/control books' fees, cash, shares, returns and observed drawdowns. Source cash coverage is retained provider evidence, not blanket issuer completeness. Later dividend repairs do not retroactively change these frozen inputs. The plots and downloads preserve the original measured results.
The editable portfolio stores finite historical allocation instructions. It is inactive and has no certified native backtest, current-session signal feed or ongoing paper performance. Future use requires fresh data, scheduling, cash-policy and broker checks. Copying the portfolio is not an instruction to activate it.
Detailed measurement and provenance notes
Read the full accounting, source and execution assumptions
Momentum uses an ex-date reinvestment total-return index. Portfolio cash follows a different clock: holdings are locked before ex-date opening trades, cash is credited on the payment date at 16:00 New York or the next actual mark, and paid cash waits for a scheduled allocation. Raw distributions are adjusted once for later splits. Unpaid receivables are excluded from the reported cash NAV. No cash interest, taxes or additional slippage are modeled.
No comments yet.