How much growth did smaller drawdowns cost?
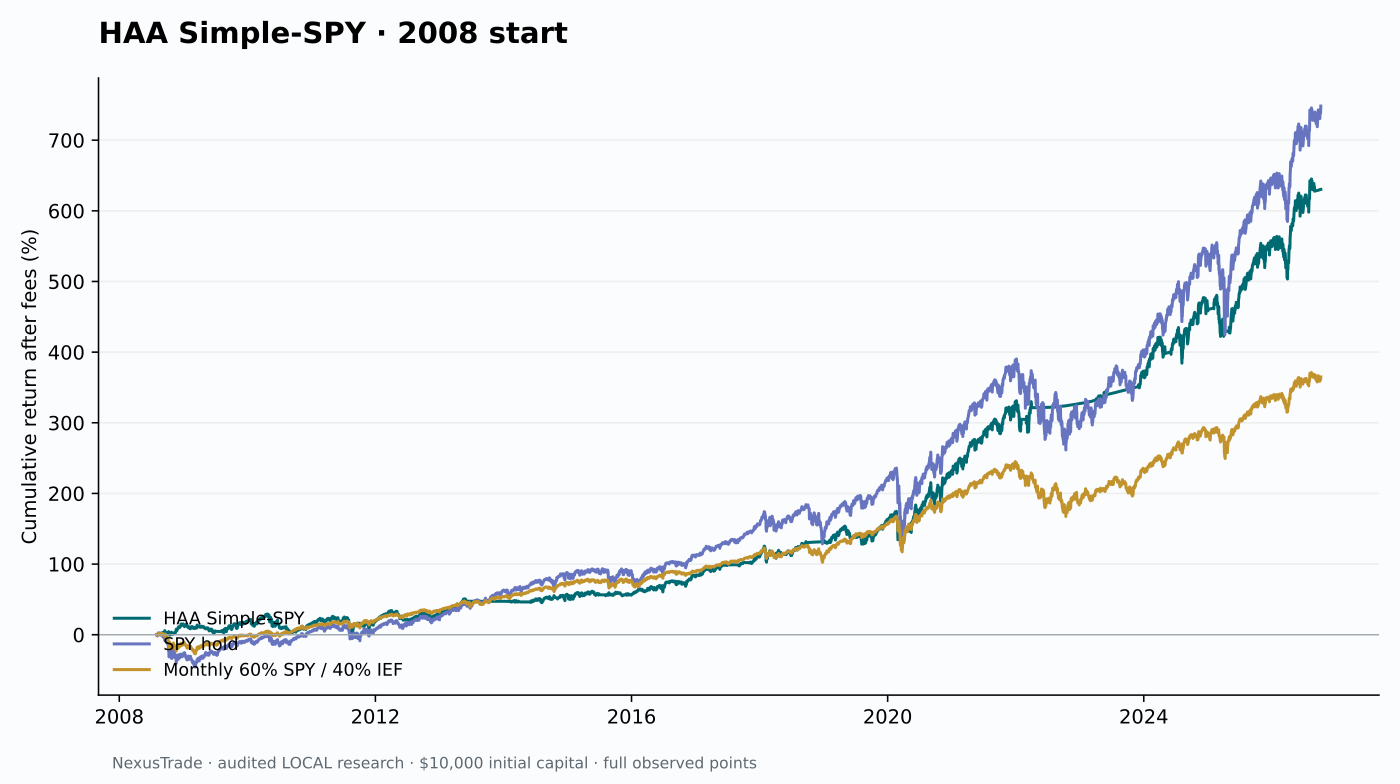
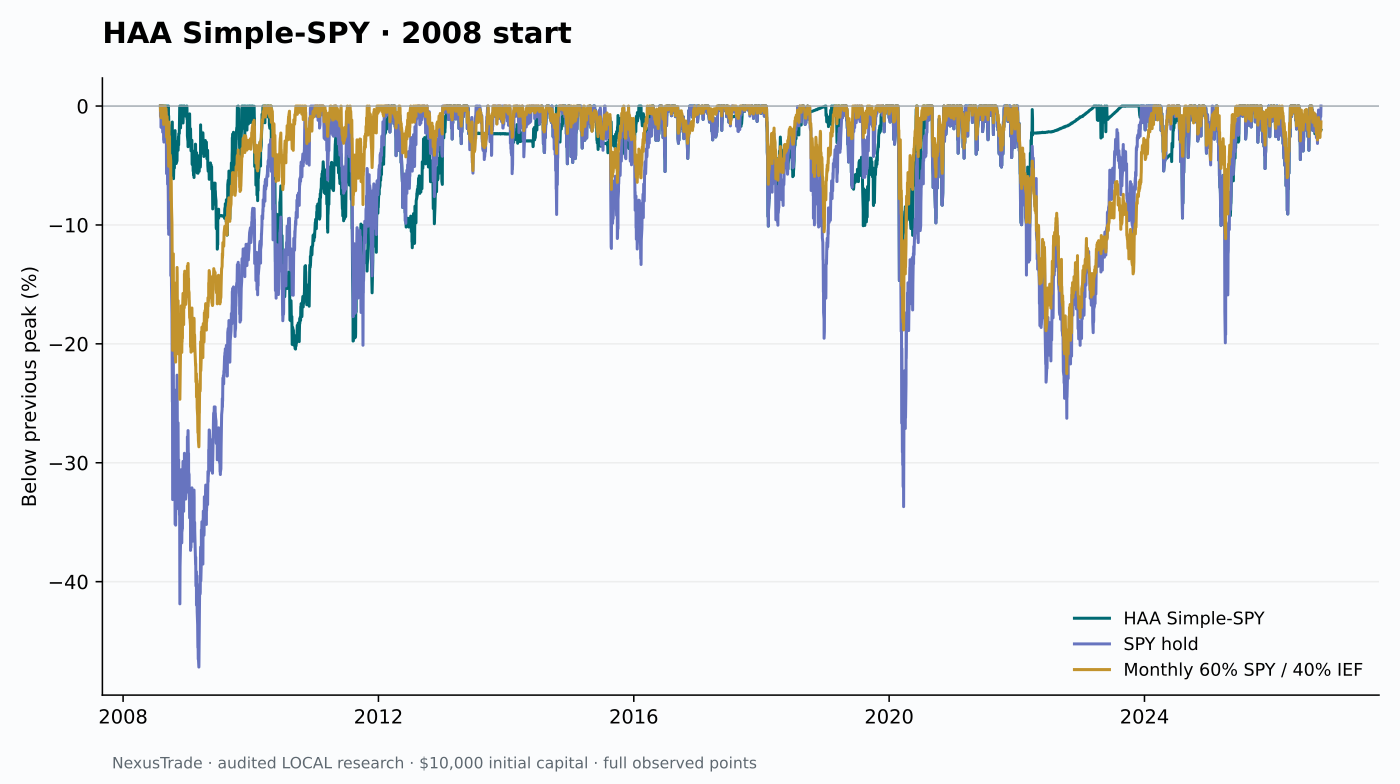
Jan Willem Keuning and Wouter Keller's Hybrid Asset Allocation uses momentum and a TIP canary to choose risk exposure. We tested the paper's published Simple-SPY control: SPY when its momentum and the canary permit it, otherwise the stronger of BIL and IEF. From August 1, 2008 through October 6, 2026, it returned 630.34% after modeled fees, with a 20.44% maximum observed drawdown. SPY hold returned 748.29%, with a much larger 47.18% drawdown.
The same trade-off appears in the newer starts. HAA lagged SPY's cumulative return, while sharply reducing observed losses and improving the daily-close zero-risk-free Sharpe statistic. That is a defensive case, not an equity-growth win. The monthly 60% SPY / 40% IEF control offers another useful comparison.
These are audited LOCAL historical simulations. The editable portfolio is an inactive finite historical snapshot, and its normal native cash/reserve behavior is not the local accounting used here. Neither author has endorsed this implementation. The 2023 paper predates the recent period, while earlier results are retrospective applications of its rules.
The broad history: a defensive trade-off
Choose the lines to compare
Cumulative return (%)
Use the line buttons to compare the strategy with its recorded controls. Then switch to drawdown to inspect the losses behind the return.
- First recorded mark
- Aug 1, 2008 · 09:29:59 NY
- Last recorded mark
- Oct 6, 2026 · 16:00:00 NY
- Vertical axis range (percent)
- -45.75 to 748.29
Simple-SPY ended at $73,033.70, versus SPY's $84,828.99 and monthly 60/40's $46,487.67. Its 11.56% CAGR lagged SPY's 12.48%. It reduced observed drawdown by more than half, but still suffered a 20.44% decline in 2010.
Choose the lines to compare
Below the prior peak (%)
Choose the lines whose losses you want to compare. Hiding a line changes this view only; the recorded dates and chart scale stay fixed.
- First recorded mark
- Aug 1, 2008 · 09:29:59 NY
- Last recorded mark
- Oct 6, 2026 · 16:00:00 NY
- Vertical axis range (percent)
- -47.18 to 0.00
Zero is a prior high; -10 means 10% below that book’s prior peak. Compare losses over the same recorded window; these marks do not measure every intraday extreme.
Protection and missed recoveries came from the same rule
On the February 2020 month-end, TIP momentum was positive but SPY momentum was negative. HAA held IEF from March 2 to April 1. That sleeve gained 4.02% while the SPY unit comparison lost 16.37%. The signal helped after the first leg of the decline; it had already held SPY through February's 7.77% losing interval.
The next month showed the cost. On March 31, SPY momentum remained negative, so HAA kept IEF through April. IEF lost 0.17% while the SPY unit comparison gained 15.05%. These are sleeve economic intervals before the next rebalance fee, not standalone portfolio backtests. Their exact source dates, targets and dollar attribution are retained in the downloads.
The lag persisted in strong equity years: the broad-start HAA book gained 10.37% in calendar 2023 while SPY gained 26.13%. Its worst observed monthly held interval was May 2010, when the source allowed SPY and the sleeve lost 9.24%. The canary did not provide a stop-loss or immediate escape.
We did not optimize a new filter to erase those losses. The report preserves the original authored configurations and the actual missed-rally events.
All three matched starts
Each book starts with $10,000 at the same real session opening and ends at the October 6, 2026 closing. Fractional shares and a 0.1% fee on every filled notional apply to all arms. Local sizing solves the entire nonborrowed after-fee budget; it does not apply the native engine's usual 1.5% reserve.
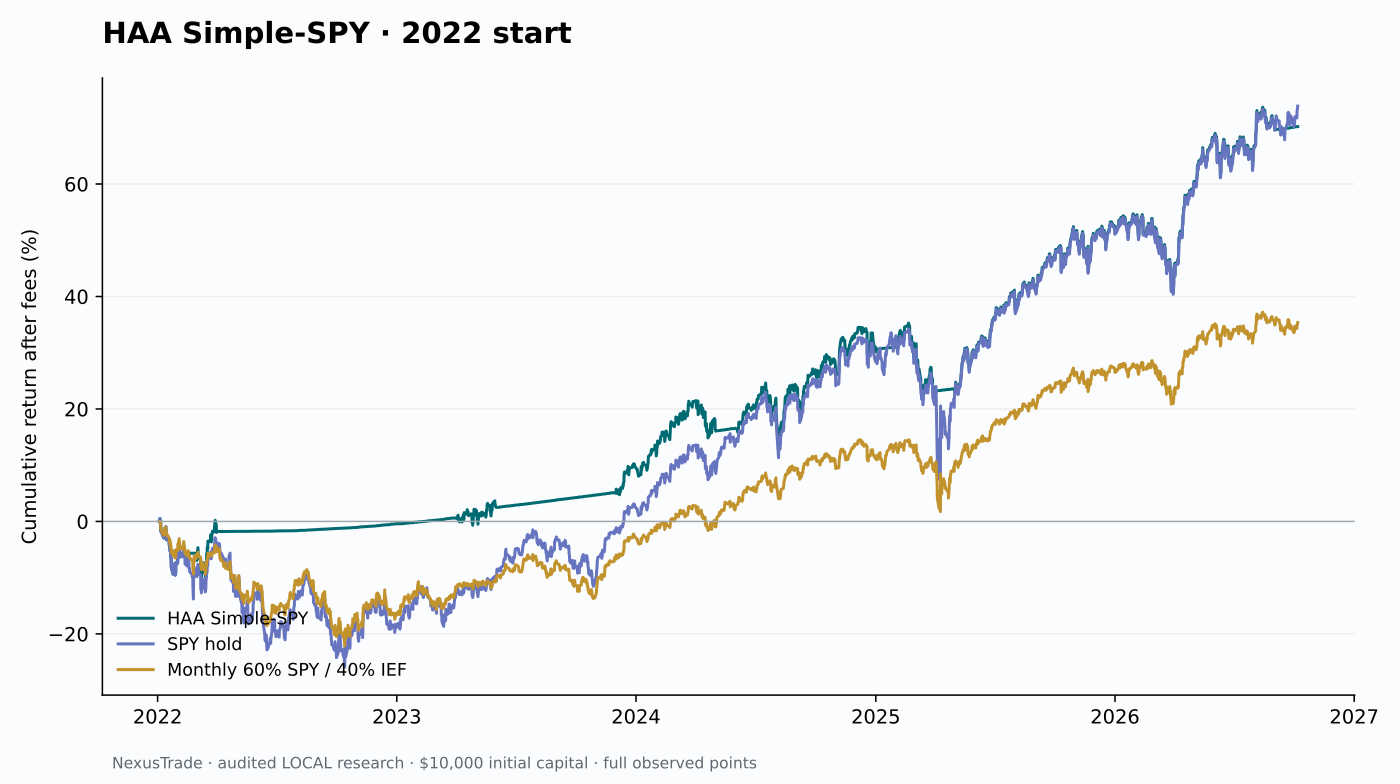
The January 2022 start spans nearly five years, not just the crash year. These overlapping retrospective windows are not independent out-of-sample tests. The broad window begins only after the common actual ETF history supports the momentum warmup; no calibrated pre-inception index history is added.
Scroll sideways to compare all columns. Select a heading to sort.
| 2008-08-01 | HAA Simple-SPY | 630.34% | 20.44% | 0.979 | $2,516.09 |
| 2008-08-01 | SPY hold | 748.29% | 47.18% | 0.698 | $18.29 |
| 2008-08-01 | Monthly 60% SPY / 40% IEF | 364.88% | 28.66% | 0.819 | $97.49 |
| 2022-01-03 | HAA Simple-SPY | 70.21% | 10.37% | 1.128 | $311.28 |
| 2022-01-03 | SPY hold | 73.86% | 26.27% | 0.762 | $10.66 |
| 2022-01-03 | Monthly 60% SPY / 40% IEF | 35.38% | 22.15% | 0.631 | $19.19 |
| 2025-01-02 | HAA Simple-SPY | 30.18% | 10.03% | 1.299 | $93.75 |
| 2025-01-02 | SPY hold | 34.56% | 19.91% | 1.084 | $10.18 |
| 2025-01-02 | Monthly 60% SPY / 40% IEF | 21.23% | 11.15% | 1.106 | $13.31 |
No matching rows. Clear the filter to see all records.
Cumulative return, not annualized. Sharpe uses daily closing returns, 252-session annualization and zero risk-free return; it differs from an excess-BIL or native Sharpe. Drawdown includes the fuller observed opening/closing economic NAV.
What the published Simple-SPY rule actually says
Simple-SPY is a published source control, rather than our modification of HAA Balanced. The paper also offers a QQQ substitution. We retained all three authored configurations and their matched controls: eighteen books across three windows. Their results remain available, including QQQ hold's much greater broad growth and HAA Balanced's lower broad drawdown. They do not make the selected Simple-SPY result a universal best model.
The authors caution that Simple's historical success can be fortunate and prefer the broader Balanced model. Their paper includes calibrated pre-inception index extensions; this study uses actual ETF observations. It does not reproduce the paper's longer historical statistics or establish that these exact rules were available before publication.
Scroll sideways to compare all columns. Select a heading to sort.
| Score | Equal average of completed-month 1-, 3-, 6- and 12-month cumulative total returns |
| Canary | TIP momentum must be strictly positive |
| Offense | SPY momentum must also be strictly positive |
| Defense | Choose the higher-scoring BIL or IEF; no extra positive-score requirement |
| Exact tie | Alphabetically ascending ticker, a disclosed implementation choice |
| Cadence | Monthly rebalance, including unchanged membership |
| Execution translation | Completed month-end signal available at 21:00 New York, then next actual regular-session opening at 09:30 |
No matching rows. Clear the filter to see all records.
Starting before stocks and bonds fell
Choose the lines to compare
Cumulative return (%)
Use the line buttons to compare the strategy with its recorded controls. Then switch to drawdown to inspect the losses behind the return.
- First recorded mark
- Jan 3, 2022 · 09:29:59 NY
- Last recorded mark
- Oct 6, 2026 · 16:00:00 NY
- Vertical axis range (percent)
- -25.89 to 73.86
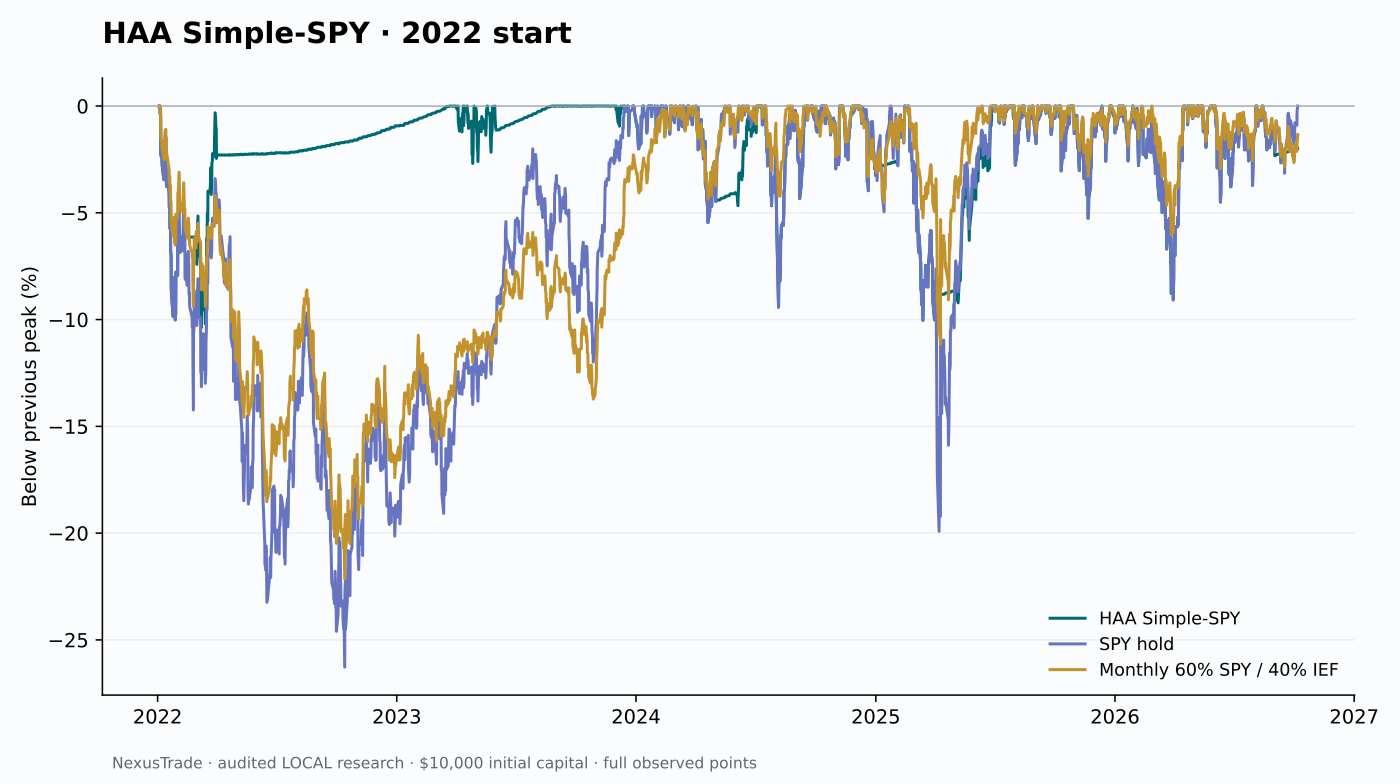
The January 2022-start HAA book lost 0.42% in calendar 2022, versus SPY's 18.50% loss and monthly 60/40's 16.62% loss. By October 2026 it returned 70.21%, slightly behind SPY's 73.86%, with 10.37% versus 26.27% maximum drawdown. These are fresh-start books; the broad-start 2022 annual outcome differs slightly.
Choose the lines to compare
Below the prior peak (%)
Choose the lines whose losses you want to compare. Hiding a line changes this view only; the recorded dates and chart scale stay fixed.
- First recorded mark
- Jan 3, 2022 · 09:29:59 NY
- Last recorded mark
- Oct 6, 2026 · 16:00:00 NY
- Vertical axis range (percent)
- -26.27 to 0.00
Zero is a prior high; -10 means 10% below that book’s prior peak. Compare losses over the same recorded window; these marks do not measure every intraday extreme.
Recent growth was lower too
Choose the lines to compare
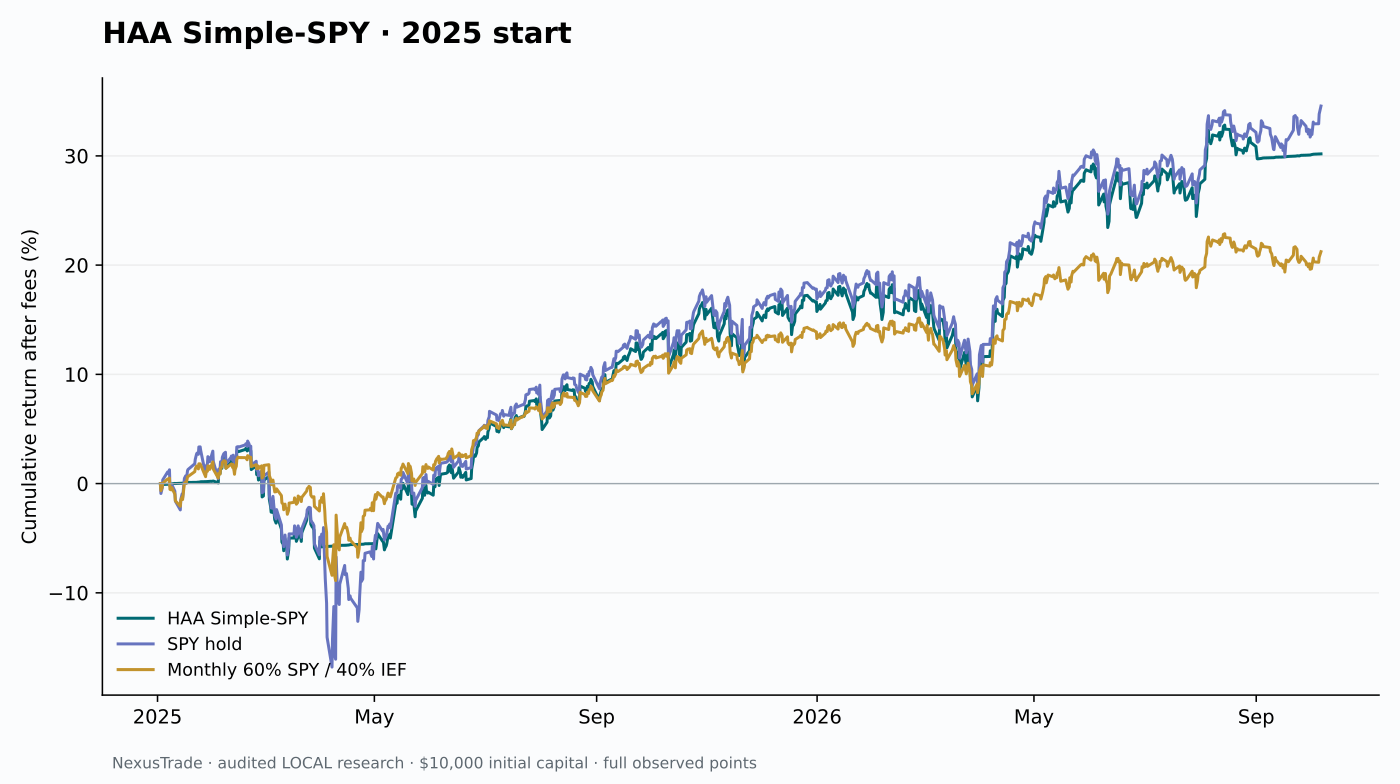
Cumulative return (%)
Use the line buttons to compare the strategy with its recorded controls. Then switch to drawdown to inspect the losses behind the return.
- First recorded mark
- Jan 2, 2025 · 09:29:59 NY
- Last recorded mark
- Oct 6, 2026 · 16:00:00 NY
- Vertical axis range (percent)
- -16.80 to 34.56
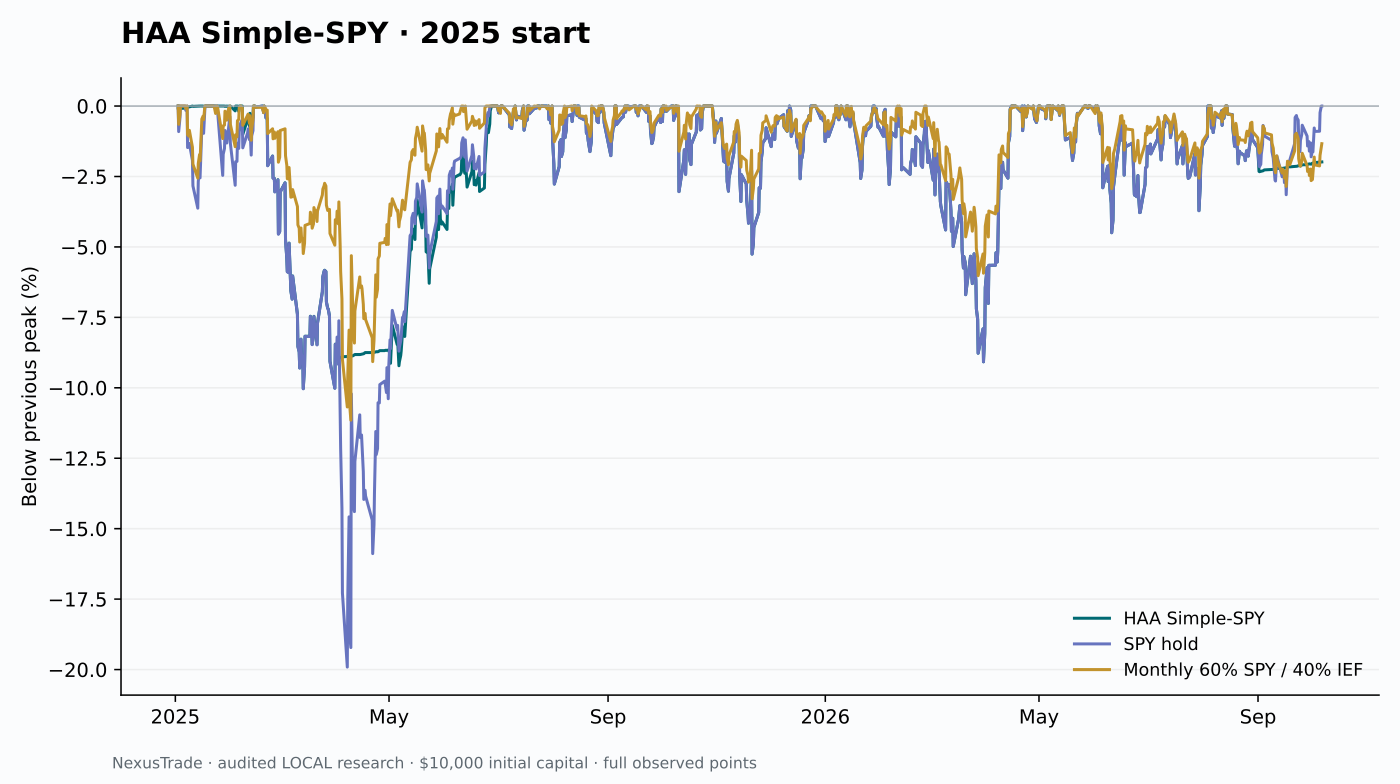
From January 2, 2025, HAA returned 30.18%, versus SPY's 34.56%. Its drawdown was 10.03%, versus SPY's 19.91%. Monthly 60/40 returned 21.23% with an 11.15% drawdown. The defensive result is meaningful, but it does not beat simply holding equities on growth.
Choose the lines to compare
Below the prior peak (%)
Choose the lines whose losses you want to compare. Hiding a line changes this view only; the recorded dates and chart scale stay fixed.
- First recorded mark
- Jan 2, 2025 · 09:29:59 NY
- Last recorded mark
- Oct 6, 2026 · 16:00:00 NY
- Vertical axis range (percent)
- -19.91 to 0.00
Zero is a prior high; -10 means 10% below that book’s prior peak. Compare losses over the same recorded window; these marks do not measure every intraday extreme.
Accounting and the editable portfolio boundary
Momentum uses total returns; trading uses actual captured split-adjusted-only opening prices. Raw cash distributions are rebased once for later splits. Holdings are locked before ex-opening trades, and income becomes buying power only on the payment clock. Reported economic NAV includes earned unpaid receivables. Strategy cash is reinvested at the next monthly allocation; passive controls reinvest paid income at the next real opening with the same fee.
The audit checked signals, dense portfolio values, fills and source payments for these eighteen frozen books. Retain the original inputs when reproducing them.
The linked portfolio is an editable inactive finite historical snapshot. Its normal native rebalance reserve and cash-only portfolio value differ from this local full-investment/accrual study. No native engine results, current signal feed or ongoing paper fills are claimed. That boundary must be closed before using it for live or recurring execution.
Public downloads contain exact measurement aggregates, annuals, full NAV observations, monthly targets and sanitized fill/dividend tapes. They omit account, job, email and original provider identifiers. Attribution to Keller and Keuning records the source idea; it does not imply collaboration or endorsement.
Detailed measurement and provenance notes
Read the full accounting, source and execution assumptions
The retained independent audit verified 2,409 momentum scores, 219 chronological monthly signals and 74,496 dense NAV marks across all eighteen books, plus fills, fees, source entitlement and payments. Specific issuer reconciliations are retained; this is not blanket certification of every provider row. Later source repairs do not silently replace these frozen research inputs.
No comments yet.