A faster exit helped, with a cost in rebounds
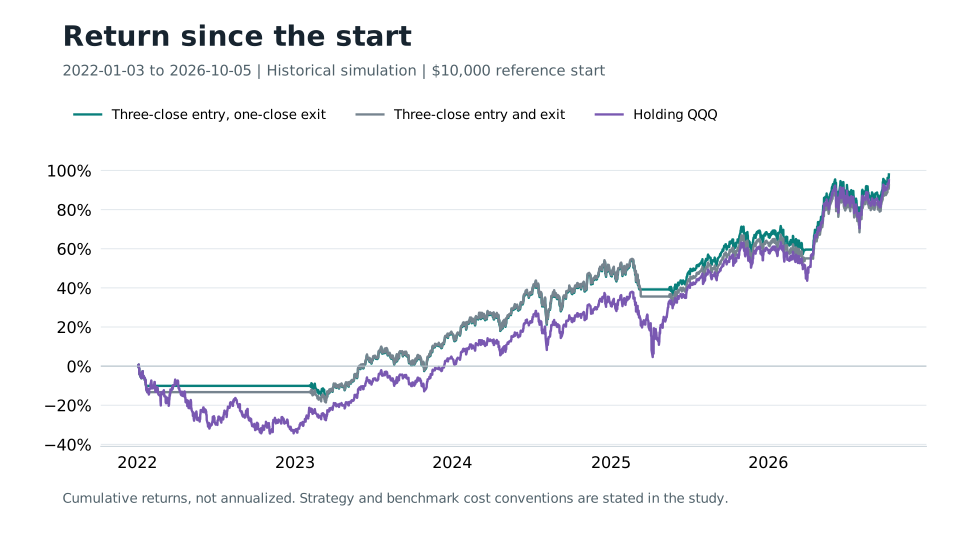
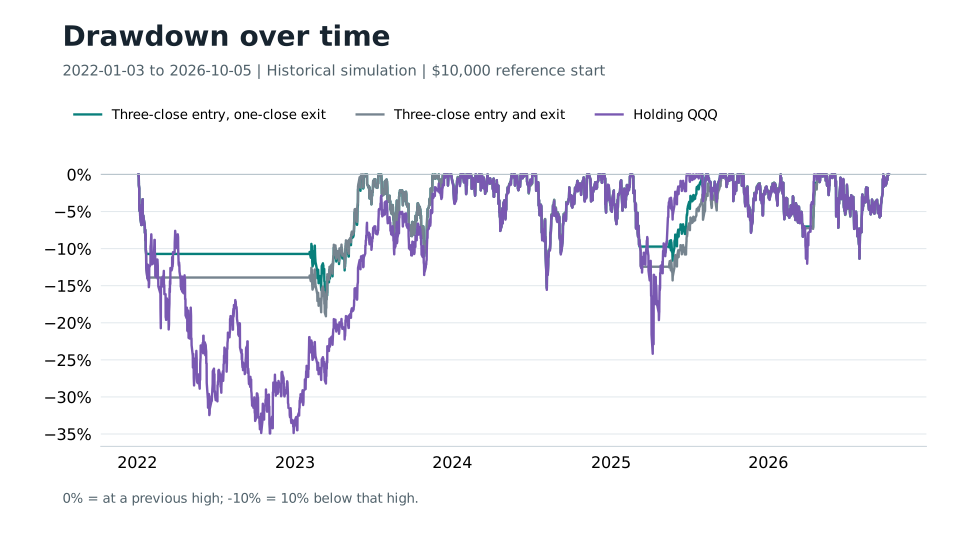
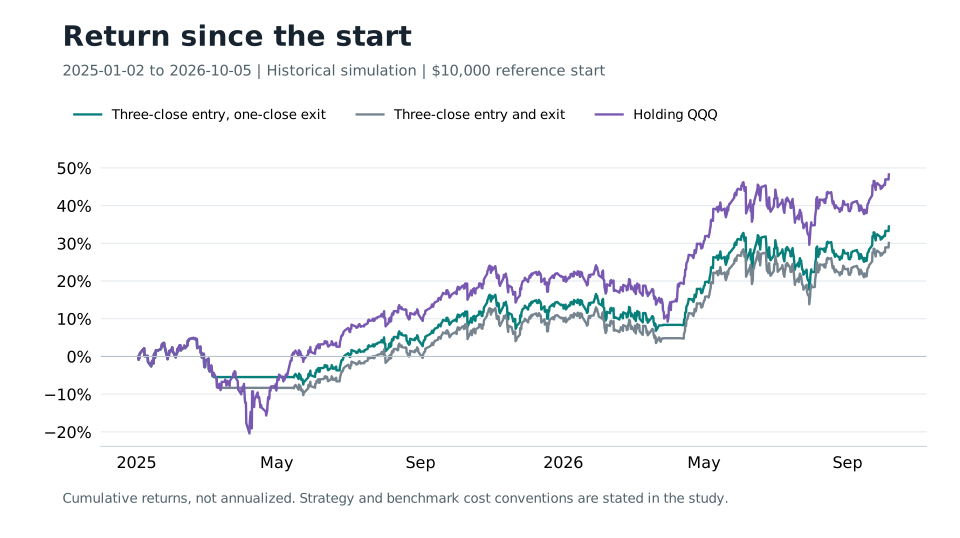
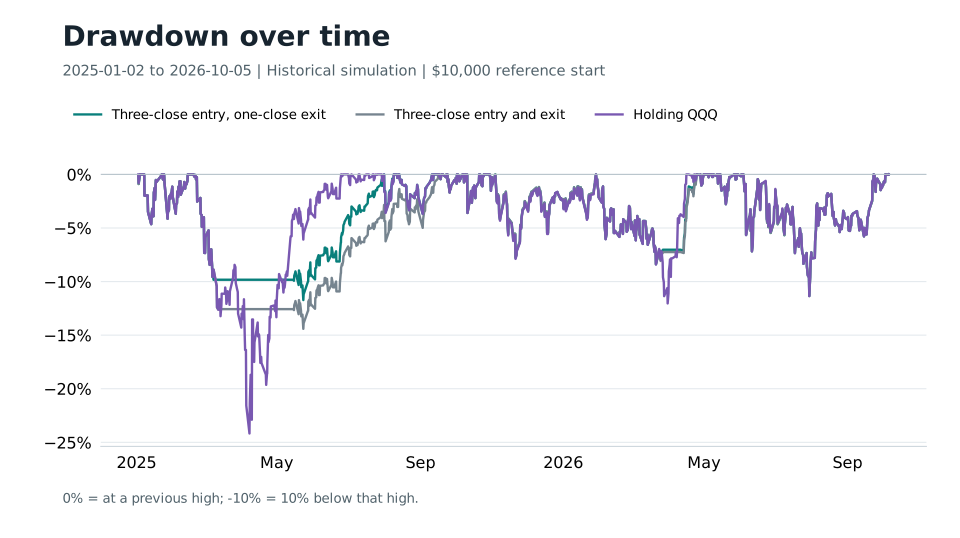
The QQQ version returned 97.96% from January 3, 2022 to October 5, 2026, after modeled trading fees. Holding QQQ returned 94.97%. Its worst observed decline fell to 16.31%, compared with 34.92% for QQQ. That broad comparison is encouraging, but the fresh January 2025 start returned 34.47% against QQQ's 48.27%.
We began with Cesar Alvarez's published research on waiting for several consecutive closes across a 200-session moving average. The first SPY implementation lagged badly. Reviewing its exits suggested testing a faster sale while leaving the three-close entry intact. This report covers both the unsuccessful SPY book and the more promising QQQ book. The one-close exit is our adaptation; Alvarez did not participate in this study or endorse it.
What stayed fixed and what changed
Scroll sideways to compare all columns. Select a heading to sort.
| Source control | Buy after three completed closes above the 200-session close average; sell after three below it. |
| Independent change | Keep the three-close entry; sell after the first completed close below the same average. |
| Execution | The following regular opening, using completed exchange sessions and actual opening prices. |
| Sizing and costs | $10,000 fresh start; fractional shares; 0.1% per stock fill; dividends retained as cash; no cash interest, additional slippage or taxes. |
| Benchmark | Native continuous SPY or QQQ total-return path with immediate dividend reinvestment and no trading fees. |
No matching rows. Clear the filter to see all records.
SPY and QQQ are separate asset tests. Moving from SPY to QQQ cannot be attributed to the exit change alone.
Broad and recent QQQ comparisons
Scroll sideways to compare all columns. Select a heading to sort.
| Jan 3, 2022 to Oct 5, 2026 | 92.38% / 19.12% decline | 97.96% / 16.31% decline | 94.97% / 34.92% decline |
| Jan 2, 2025 to Oct 5, 2026 | 30.08% / 14.41% decline | 34.47% / 11.72% decline | 48.27% / 24.17% decline |
No matching rows. Clear the filter to see all records.
Each cell shows cumulative return / maximum observed drawdown. Recent tests restart with $10,000; they are not slices of the continuous broad book.
QQQ: the broad historical test
QQQ: the recent return lag
The exits that led to the change
In the SPY run, a December 2022 entry at $403.95 exited after three below-average closes at $395.14. An October 2023 exit at $413.56 was followed by reentry at $435.69. Those actual events gave us a reason to inspect exit delay rather than add unrelated filters. Cash also avoided a 7.78% price loss during an earlier 2022 interval, so staying invested was not always preferable.
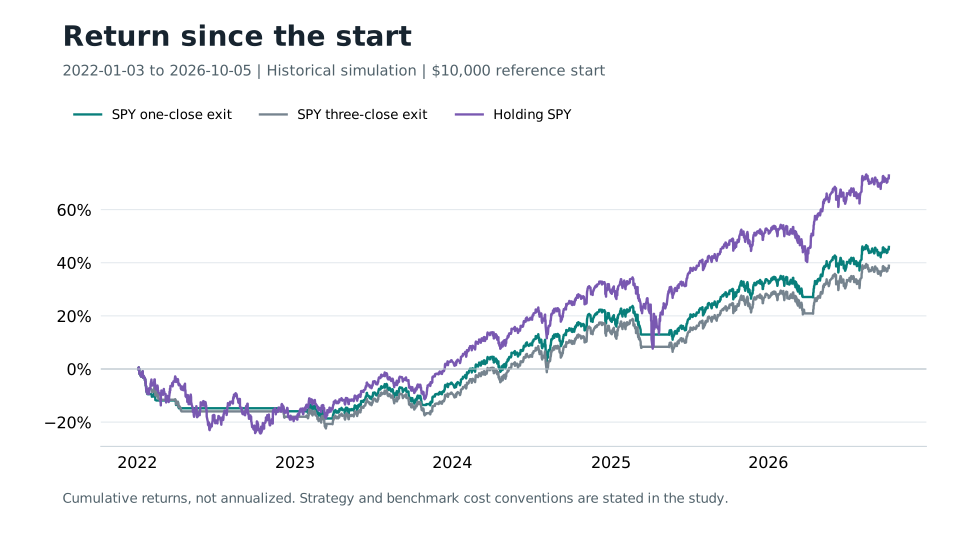
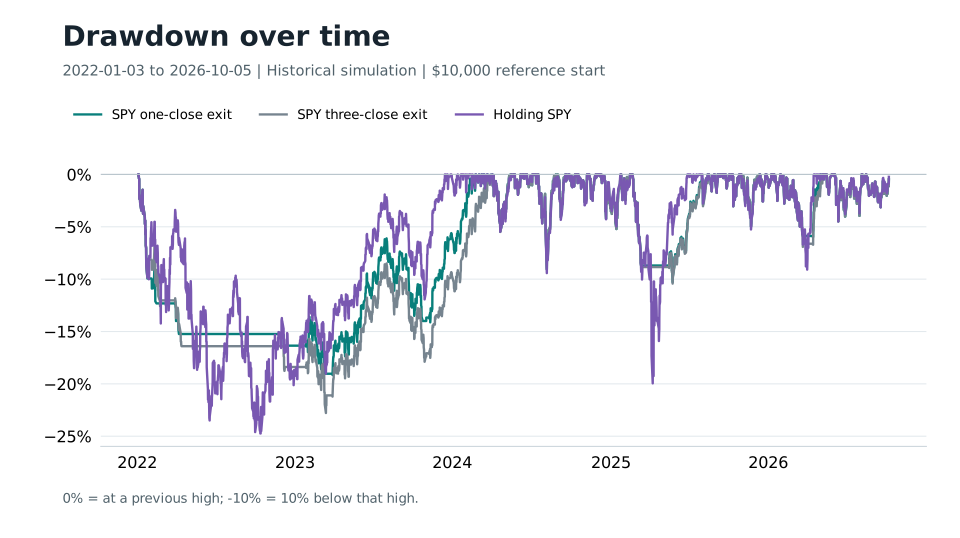
The matched SPY one-close test improved return from 38.85% to 45.94% and drawdown from 22.78% to 19.15%. Holding SPY still returned 72.83%. Seven exit prices improved, but the January 2022 exit worsened from $440.72 to $432.03. The change did not reduce the number of closed trades.
The QQQ adaptation introduced a March 2023 whipsaw: a sale near $286.73 followed by reentry near $298. Its separate 2023 fresh-start test returned 29.56%, below the three-close version's 34.92%. Faster exits can protect a decline and sell just before a recovery. Both effects remain in the evidence.
SPY was not rescued
Scroll sideways to compare all columns. Select a heading to sort.
| Jan 3, 2022 to Oct 5, 2026 | 38.85% / 22.78% decline | 45.94% / 19.15% decline | 72.83% / 24.74% decline |
| Jan 2, 2025 to Oct 5, 2026 | 21.20% / 10.55% decline | 22.36% / 10.41% decline | 33.65% / 19.95% decline |
No matching rows. Clear the filter to see all records.
The rejected SPY experiment remains part of the study. Better than its own control did not mean market-comparable return.
SPY: improvement below the market baseline
What the record supports
The broad QQQ one-close book paid $104.36 in modeled fees and received $249.18 in cash dividends across nine fills. Completed-close signals and next-opening fills were inspected. The public downloads preserve all archived NAV and benchmark observations; they do not include a complete independently reproducible market-data tape.
These are retrospective research results from dates and variants already examined. The small broad return lead does not establish a future edge. The listed QQQ portfolio is an editable research implementation; historical charts and any later paper-trading record should be evaluated separately.
No comments yet.