Do congressional stock purchases beat SPY?
Show the table · 4 rows, 4 columns
Scroll sideways to compare all columns. Select a heading to sort.
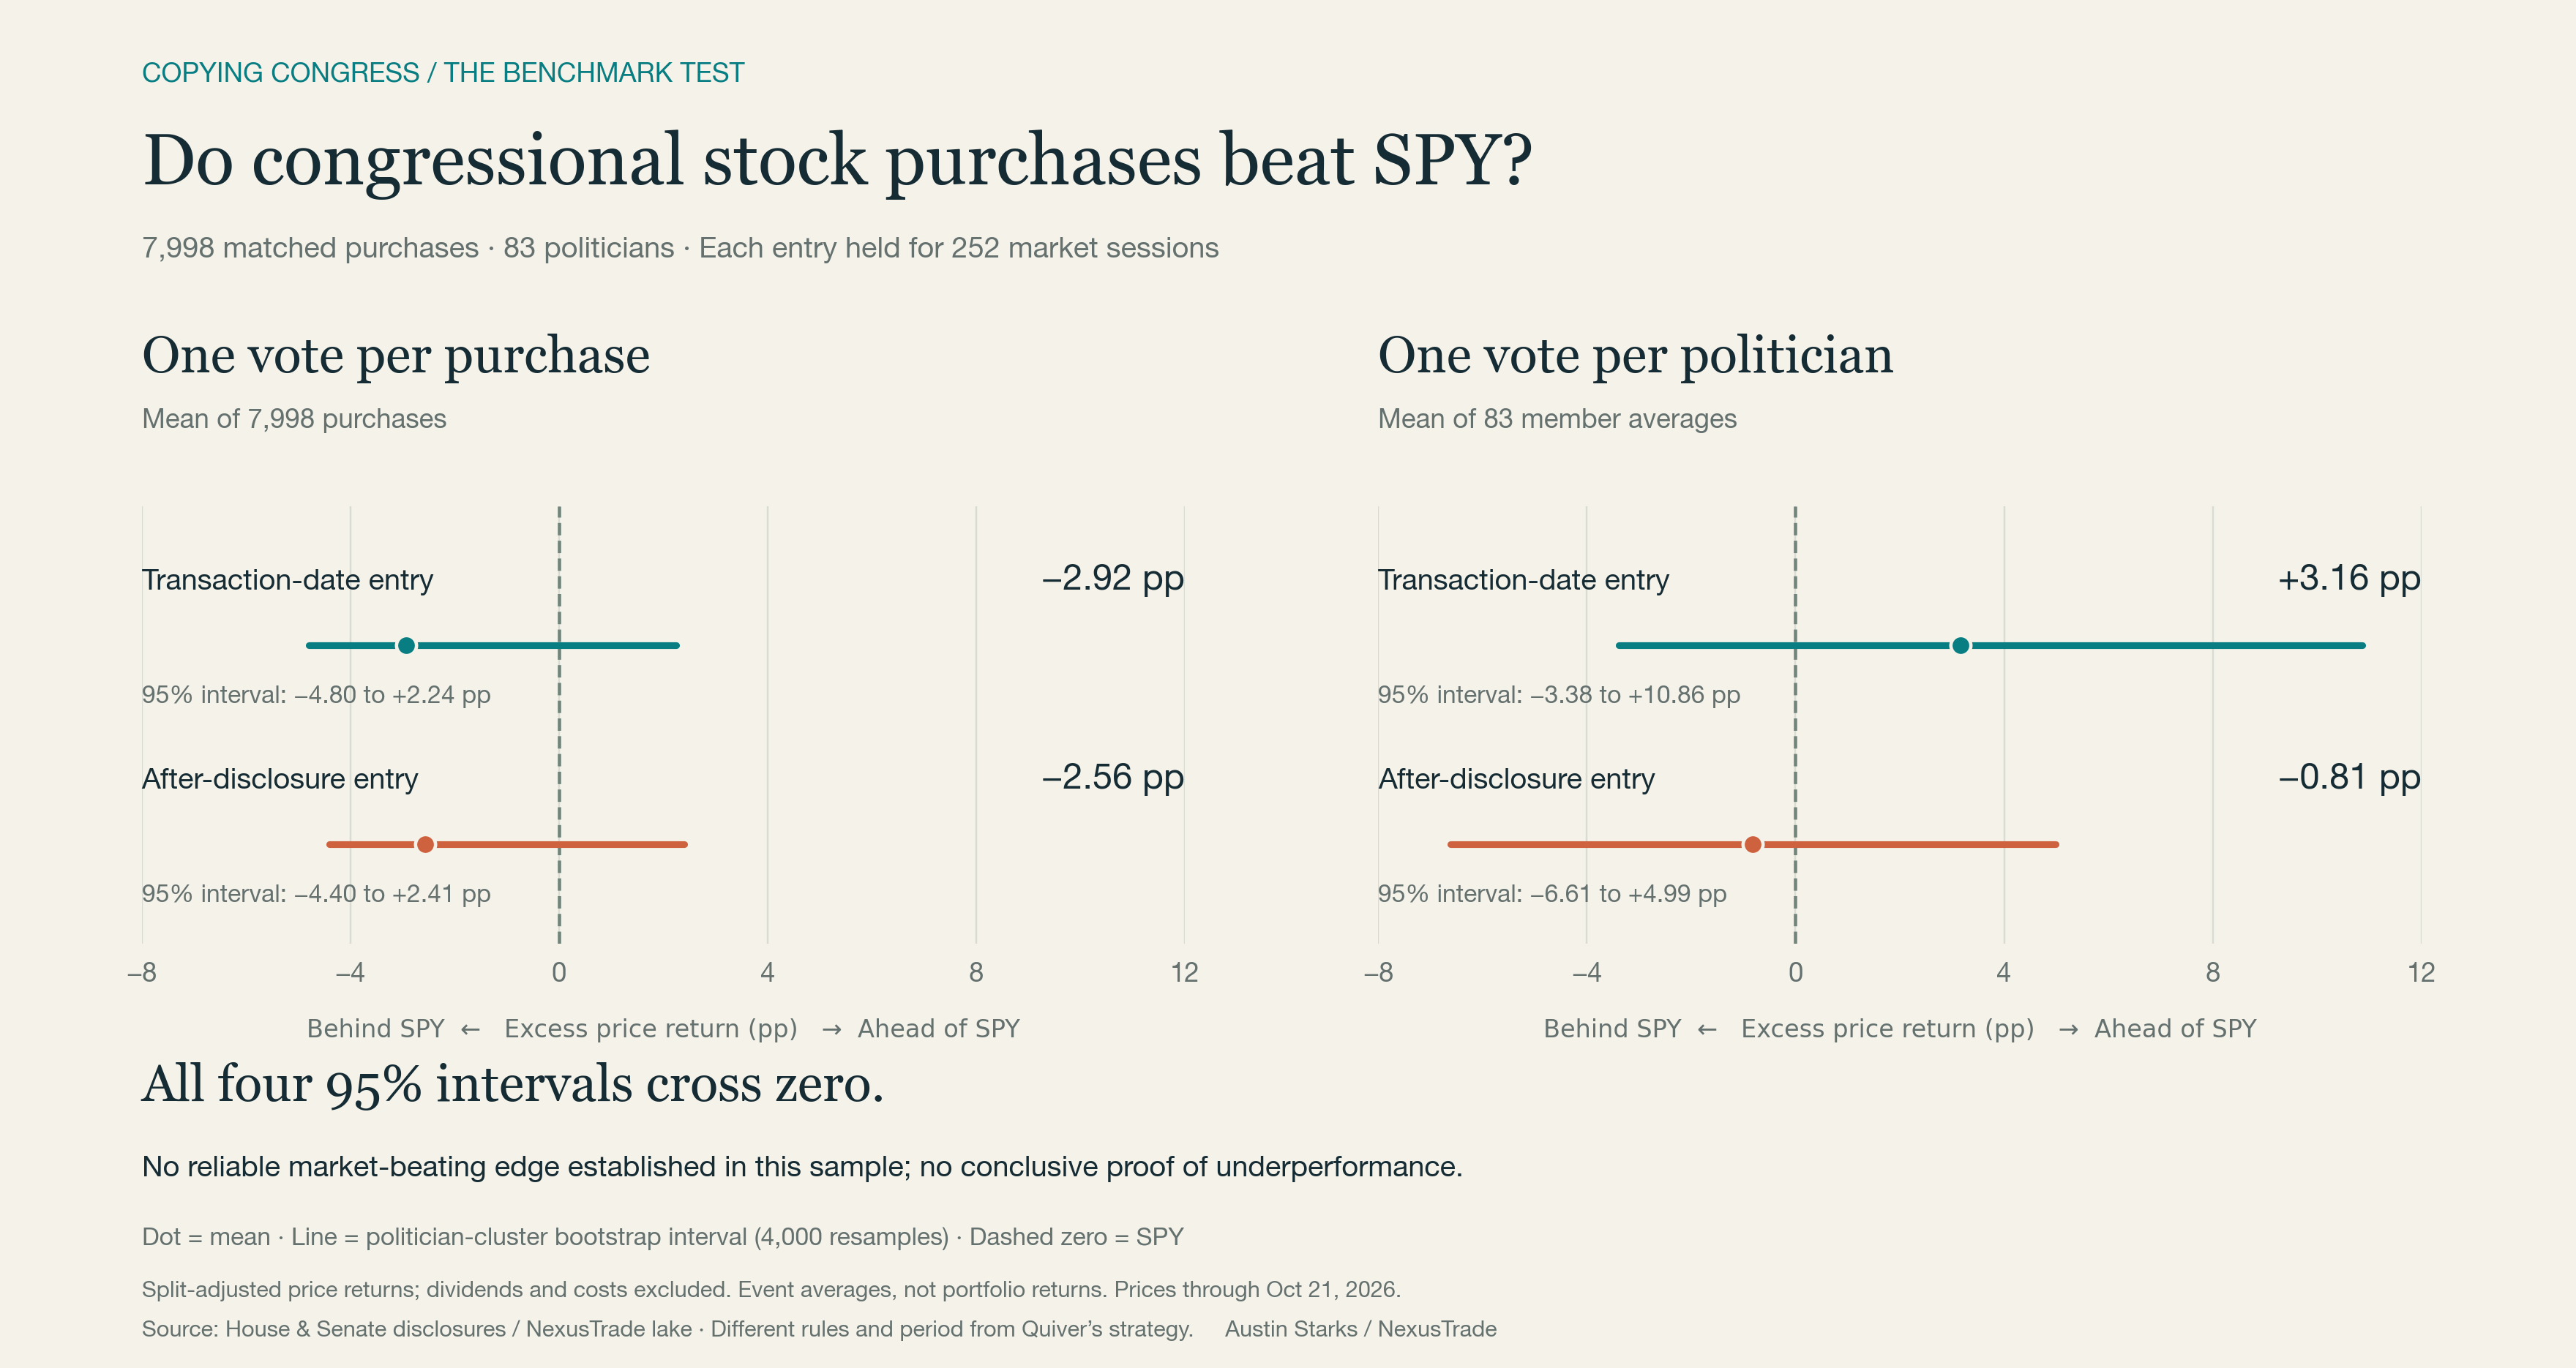
| One vote per purchase | Transaction date | −2.92 | −4.80 to +2.24 |
| One vote per purchase | After disclosure | −2.56 | −4.40 to +2.41 |
| One vote per politician | Transaction date | +3.16 | −3.38 to +10.86 |
| One vote per politician | After disclosure | −0.81 | −6.61 to +4.99 |
No matching rows. Clear the filter to see all records.
Exact rounded values shown in the benchmark chart. Price-return differences in percentage points, with politician-cluster bootstrap intervals.
Each entry is held for 252 market sessions from its own start, so the exit dates differ. Both arms contain the same 7,998 matched purchases across 83 politicians. This fixed-horizon cohort is separate from the 8,385-purchase common-exit timing cohort below. The chart shows average stock price return minus SPY over each arm’s exact dates, in percentage points.
Dots mark the estimated averages; lines show descriptive 95% politician-cluster bootstrap intervals. The dashed zero line means matching SPY. Every interval crosses zero, leaving both underperformance and outperformance compatible with the estimates. These event averages establish no reliable market-beating edge in this sample and do not prove that every congressional copy strategy underperforms.
Weighting matters: one vote per politician changes the transaction-date estimate to +3.16 points and the public-entry estimate to −0.81 points. Ro Khanna accounts for 47.6% of purchases in this fixed-horizon cohort.
Quiver’s quoted claim uses different portfolio rules and an earlier period. This comparison neither validates nor refutes its stated historical return. Returns here exclude dividends, fees and taxes and measure event averages rather than a funded portfolio.
The promise behind copying Congress
In a November 15, 2023 update, Quiver Quantitative said its Congress Buys strategy had “continued to consistently outperform the market.” The strategy tracks congressional purchases, weights them by reported size and rebalances weekly.
That is the attraction of copying politicians. But by the time a filing is public, the purchase may be weeks old. Is the useful information in which stock they bought, or in when they bought it? We tested two questions: do the purchases beat SPY, and does buying before disclosure improve the result?
Two questions. Two findings.
Stock selection: no reliable market-beating edge established in this sample. The average purchase lagged SPY by 2.92 percentage points at the transaction-date entry and 2.56 points after disclosure. Both 95% uncertainty intervals cross zero. Equal weighting by politician changes the estimates, with intervals still spanning zero.
Entry timing: no clear average benefit from buying earlier. With a shared exit, the early-minus-public excess-return gap averaged −0.27 points, with a 95% interval of −0.86 to +0.20 points. This paired timing difference answers a separate question from performance against SPY.
Same stocks. Two entry dates. One exit.
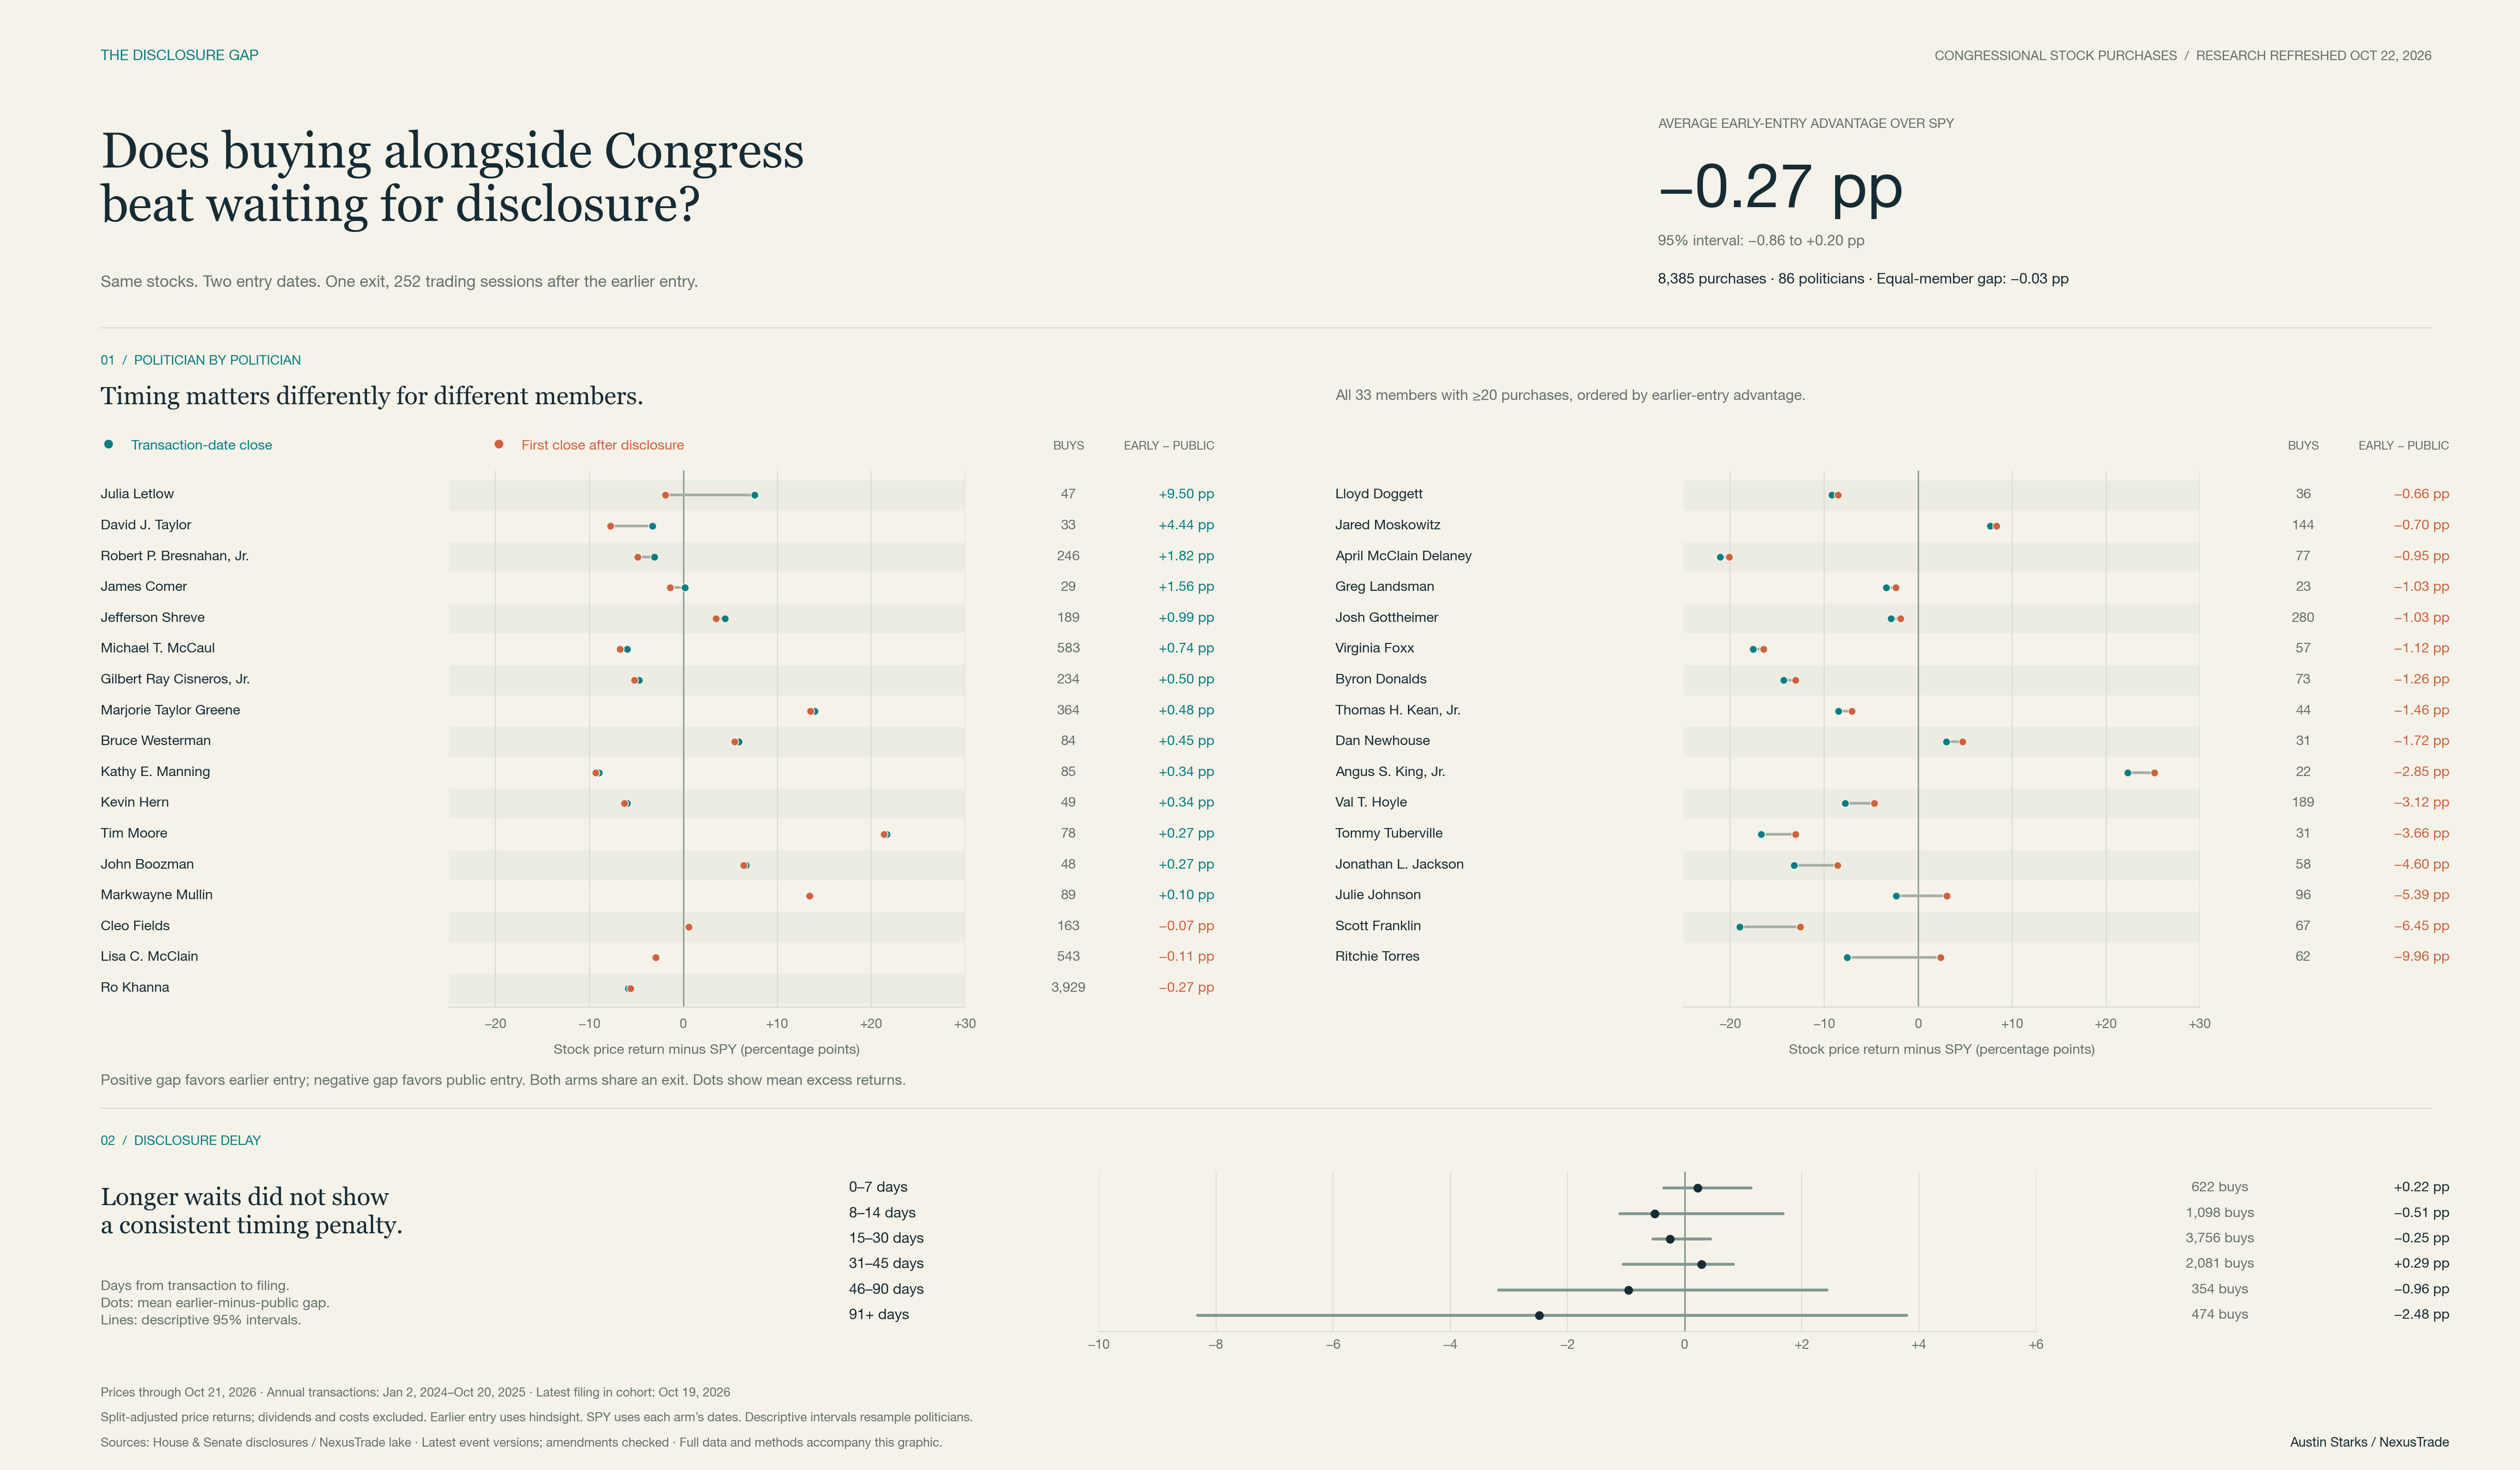
Buying on the reported transaction date produced an average timing gap of −0.27 percentage points relative to buying after disclosure, after subtracting SPY over each entry’s actual investment interval. The member-cluster 95% interval was −0.86 to +0.20 points. This sample does not establish a clear average timing advantage.
The comparison contains 8,385 matched common-stock and ADR purchases across 86 politicians. Both entries share an exit 252 market sessions after the earlier entry. The earlier arm uses the transaction-date close; the public arm uses the first close after the filing’s New York calendar date.
Giving each politician equal weight changes the mean gap to −0.03 points, with an interval of −1.88 to +1.63 points. Ro Khanna accounts for about 46.9% of the trade-weighted annual sample, so the weighting choice matters.
Does a longer disclosure delay change the result?
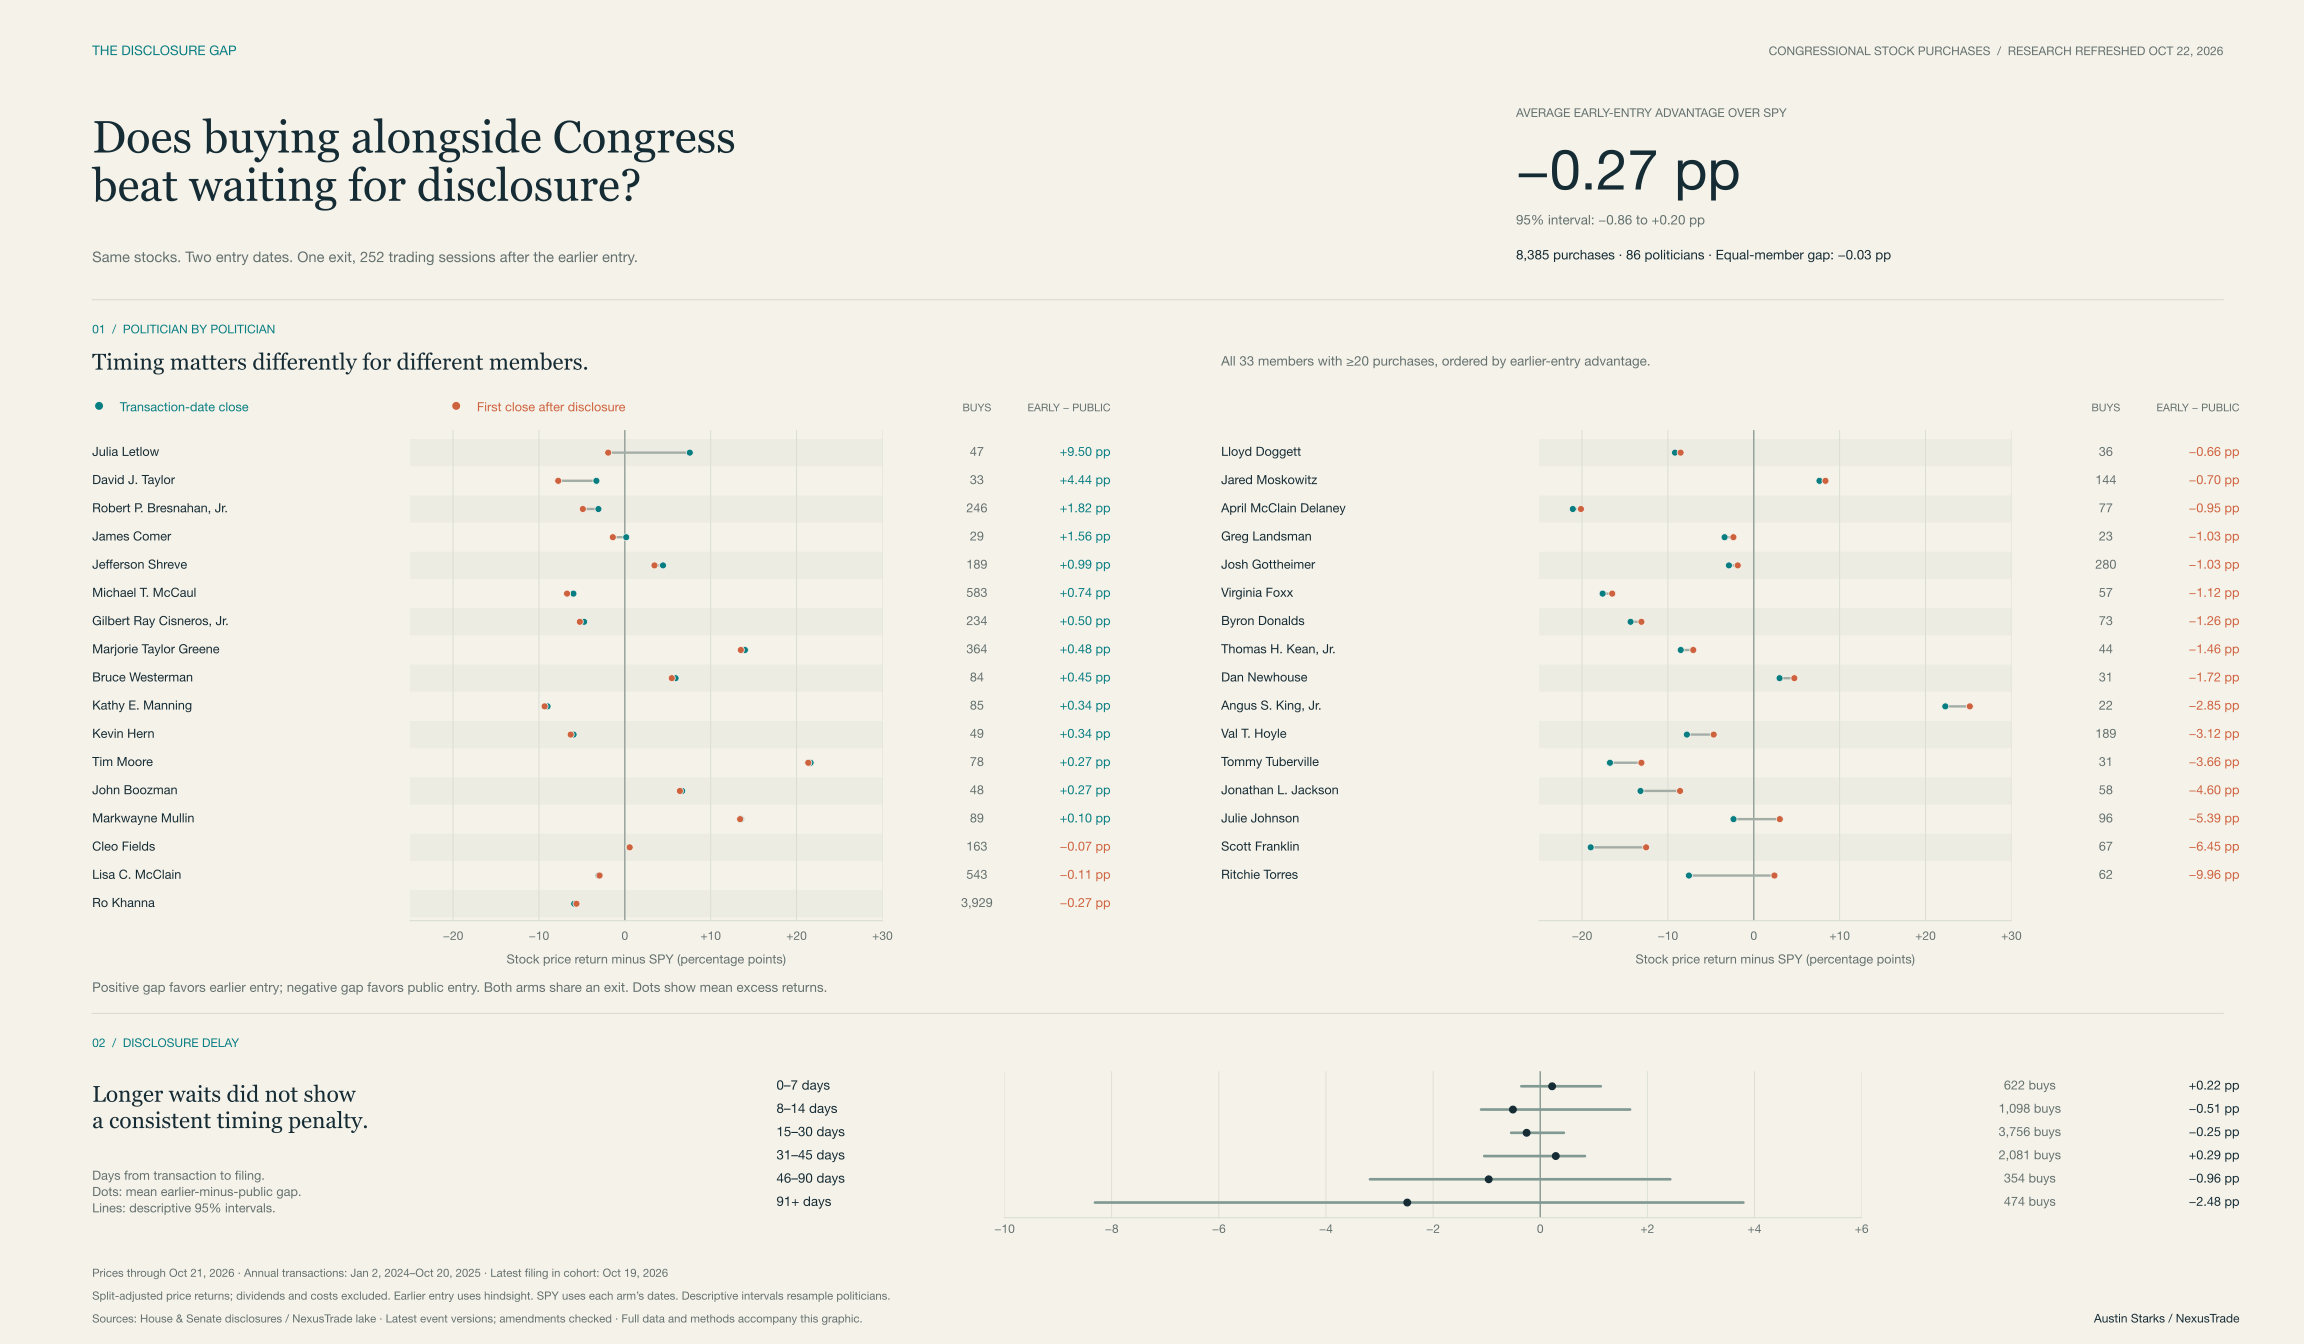
The annual sample is split into six groups by calendar days between transaction and filing. All six descriptive member-cluster intervals span zero. The group means do not show a consistent penalty from waiting longer. These groups contain different purchases and politicians; this is an association, not a causal estimate of delay.
Show the table · 6 rows, 7 columns
Scroll sideways to compare all columns. Select a heading to sort.
| 0–7 days | 622 | 29 | +3.32 | +3.10 | +0.22 | −0.35 to +1.13 |
| 8–14 days | 1098 | 42 | −5.45 | −4.94 | −0.51 | −1.10 to +1.68 |
| 15–30 days | 3756 | 59 | −3.27 | −3.01 | −0.25 | −0.54 to +0.44 |
| 31–45 days | 2081 | 49 | −4.00 | −4.29 | +0.29 | −1.04 to +0.83 |
| 46–90 days | 354 | 14 | −1.27 | −0.31 | −0.96 | −3.18 to +2.43 |
| 91+ days | 474 | 16 | −6.83 | −4.35 | −2.48 | −8.31 to +3.79 |
No matching rows. Clear the filter to see all records.
Annual common-exit cohort; each purchase receives equal weight. Intervals resample politicians, retaining all of a sampled politician’s trades together.
Every politician: the annual breakdown
Search a name or sort a column in the table. Positive timing gaps favor earlier entry; negative gaps favor public entry. Small samples remain visible, with their purchase and stock counts, rather than being presented as established skill.
Nancy Pelosi has two qualifying annual purchases in one stock after option-related acquisitions and exercises are excluded. That row is retained in the full table and omitted from the poster’s 20-purchase minimum. The study measures hypothetical stock price returns, including spouse and household transactions attributed to a member; it does not measure household account profits.
Show the table · 86 rows, 7 columns
Scroll sideways to compare all columns. Select a heading to sort.
| Ron Wyden (small sample) | 1 | 1 | +27.50 | +5.34 | +22.16 | Single security |
| Tina Smith (small sample) | 1 | 1 | +37.91 | +19.94 | +17.97 | Single security |
| Brad Knott (small sample) | 2 | 1 | +47.46 | +31.07 | +16.40 | Single security |
| Stephen F. Lynch (small sample) | 1 | 1 | +31.13 | +15.61 | +15.52 | Single security |
| Jerry Moran (small sample) | 4 | 1 | +117.49 | +106.19 | +11.30 | Single security |
| Julia Letlow | 47 | 45 | +7.57 | −1.93 | +9.50 | −9.76 to +35.96 |
| Ed Case (small sample) | 2 | 1 | +13.62 | +4.39 | +9.23 | Single security |
| John Fetterman (small sample) | 2 | 2 | +54.14 | +45.03 | +9.11 | +1.54 to +16.67 |
| Michael Guest (small sample) | 5 | 5 | +7.94 | −0.95 | +8.89 | −14.46 to +32.25 |
| Terri A. Sewell (small sample) | 2 | 2 | +26.92 | +18.06 | +8.86 | +0.32 to +17.39 |
| Maria Elvira Salazar (small sample) | 5 | 4 | +8.85 | +3.08 | +5.77 | −1.20 to +11.85 |
| Victoria Spartz (small sample) | 6 | 1 | +2.95 | −2.75 | +5.69 | Single security |
| John James (small sample) | 18 | 12 | +1.60 | −3.79 | +5.39 | −2.29 to +12.97 |
| Debbie Dingell (small sample) | 2 | 2 | +9.45 | +4.26 | +5.18 | +1.36 to +9.00 |
| Laurel M. Lee (small sample) | 4 | 3 | −19.53 | −24.42 | +4.89 | −13.20 to +17.06 |
| David J. Taylor | 33 | 19 | −3.31 | −7.75 | +4.44 | +0.92 to +8.53 |
| Kelly Morrison (small sample) | 10 | 3 | +18.66 | +14.53 | +4.12 | −9.32 to +14.06 |
| Morgan McGarvey (small sample) | 6 | 6 | +3.88 | +0.96 | +2.92 | −3.68 to +10.95 |
| Judy Chu (small sample) | 2 | 1 | −15.20 | −17.88 | +2.69 | Single security |
| Brian J. Mast (small sample) | 3 | 2 | +31.95 | +29.27 | +2.68 | −0.91 to +4.48 |
| Nancy Pelosi (small sample) | 2 | 1 | +26.88 | +24.57 | +2.31 | Single security |
| Thomas R. Suozzi (small sample) | 1 | 1 | +24.56 | +22.39 | +2.17 | Single security |
| Katie Boyd Britt (small sample) | 14 | 11 | +5.86 | +3.72 | +2.14 | −21.45 to +23.18 |
| John W. Hickenlooper (small sample) | 3 | 3 | −26.07 | −28.03 | +1.96 | −5.47 to +11.61 |
| Robert P. Bresnahan, Jr. | 246 | 166 | −3.07 | −4.89 | +1.82 | −0.52 to +4.15 |
| James Comer | 29 | 24 | +0.17 | −1.39 | +1.56 | −2.62 to +8.86 |
| W. Gregory Steube (small sample) | 1 | 1 | +25.00 | +23.52 | +1.48 | Single security |
| Rick W. Allen (small sample) | 9 | 8 | −13.31 | −14.68 | +1.37 | −2.23 to +4.63 |
| Pete Sessions (small sample) | 9 | 5 | +14.20 | +13.01 | +1.19 | −1.15 to +3.13 |
| Jefferson Shreve | 189 | 147 | +4.45 | +3.45 | +0.99 | −1.48 to +3.86 |
| Earl Blumenauer (small sample) | 13 | 10 | −2.06 | −2.99 | +0.94 | −1.96 to +5.05 |
| Rick Larsen (small sample) | 13 | 13 | −11.25 | −12.12 | +0.87 | −0.91 to +2.70 |
| Doug Lamborn (small sample) | 6 | 1 | −25.93 | −26.73 | +0.80 | Single security |
| William R. Keating (small sample) | 15 | 12 | −3.49 | −4.27 | +0.78 | −0.81 to +2.18 |
| Michael T. McCaul | 583 | 108 | −5.98 | −6.73 | +0.74 | −1.13 to +3.06 |
| Tony Wied (small sample) | 11 | 9 | −19.74 | −20.36 | +0.62 | −10.00 to +13.18 |
| Gilbert Ray Cisneros, Jr. | 234 | 135 | −4.74 | −5.24 | +0.50 | −1.51 to +2.74 |
| Marjorie Taylor Greene | 364 | 76 | +13.99 | +13.51 | +0.48 | −0.20 to +1.24 |
| Bruce Westerman | 84 | 77 | +5.91 | +5.47 | +0.45 | −2.16 to +3.05 |
| Kathy E. Manning | 85 | 30 | −9.00 | −9.34 | +0.34 | −1.70 to +2.17 |
| Kevin Hern | 49 | 21 | −5.96 | −6.30 | +0.34 | −1.20 to +1.80 |
| Tim Moore | 78 | 16 | +21.63 | +21.36 | +0.27 | −5.57 to +11.02 |
| John Boozman | 48 | 26 | +6.68 | +6.42 | +0.27 | −5.28 to +5.03 |
| Nicole Malliotakis (small sample) | 2 | 2 | −10.70 | −10.86 | +0.16 | −3.05 to +3.38 |
| Markwayne Mullin | 89 | 47 | +13.53 | +13.43 | +0.10 | −3.82 to +3.88 |
| Keith Self (small sample) | 2 | 2 | −0.86 | −0.86 | −0.00 | −1.03 to +1.03 |
| Cleo Fields | 163 | 26 | +0.50 | +0.57 | −0.07 | −3.68 to +1.94 |
| Lisa C. McClain | 543 | 416 | −3.05 | −2.94 | −0.11 | −2.60 to +3.16 |
| Thomas R. Carper (small sample) | 14 | 13 | −14.56 | −14.40 | −0.16 | −4.09 to +3.66 |
| Ro Khanna | 3929 | 511 | −5.89 | −5.63 | −0.27 | −1.06 to +0.72 |
| Jim Banks (small sample) | 2 | 2 | −10.69 | −10.40 | −0.28 | −2.18 to +1.61 |
| Robert E. Latta (small sample) | 10 | 1 | −6.28 | −5.76 | −0.52 | Single security |
| Sheldon Whitehouse (small sample) | 6 | 6 | −1.58 | −1.06 | −0.53 | −6.82 to +6.87 |
| Lloyd Doggett | 36 | 6 | −9.17 | −8.52 | −0.66 | −2.54 to +1.31 |
| Jared Moskowitz | 144 | 55 | +7.65 | +8.35 | −0.70 | −4.80 to +2.45 |
| April McClain Delaney | 77 | 21 | −21.07 | −20.13 | −0.95 | −4.02 to +1.75 |
| Carol D. Miller (small sample) | 9 | 9 | −8.67 | −7.68 | −0.99 | −4.91 to +2.76 |
| Greg Landsman | 23 | 15 | −3.40 | −2.37 | −1.03 | −4.96 to +2.89 |
| Josh Gottheimer | 280 | 121 | −2.89 | −1.86 | −1.03 | −2.43 to +0.43 |
| Virginia Foxx | 57 | 14 | −17.60 | −16.48 | −1.12 | −2.77 to +0.19 |
| Byron Donalds | 73 | 30 | −14.35 | −13.08 | −1.26 | −4.85 to +3.05 |
| Thomas H. Kean, Jr. | 44 | 23 | −8.50 | −7.05 | −1.46 | −4.48 to +1.43 |
| Dan Newhouse | 31 | 31 | +3.00 | +4.73 | −1.72 | −5.65 to +2.26 |
| Shelley Moore Capito (small sample) | 19 | 12 | +18.04 | +20.32 | −2.28 | −6.84 to +1.14 |
| Roger Williams (small sample) | 1 | 1 | −16.13 | −13.67 | −2.46 | Single security |
| Michael C. Burgess (small sample) | 6 | 3 | −19.98 | −17.51 | −2.47 | −7.88 to +0.00 |
| Angus S. King, Jr. | 22 | 22 | +22.31 | +25.16 | −2.85 | −9.80 to +2.98 |
| Vicente Gonzalez (small sample) | 3 | 2 | +24.03 | +26.93 | −2.90 | −4.92 to +1.14 |
| Val T. Hoyle | 189 | 155 | −7.79 | −4.67 | −3.12 | −8.06 to +1.47 |
| Tommy Tuberville | 31 | 25 | −16.74 | −13.08 | −3.66 | −6.49 to −0.49 |
| Charles J. "Chuck" Fleischmann (small sample) | 4 | 4 | −14.79 | −10.56 | −4.23 | −9.56 to +1.11 |
| Jonathan L. Jackson | 58 | 35 | −13.19 | −8.58 | −4.60 | −9.78 to +0.57 |
| Mitch McConnell (small sample) | 7 | 1 | +1.77 | +6.54 | −4.77 | Single security |
| Cliff Bentz (small sample) | 2 | 2 | −18.36 | −13.51 | −4.84 | −8.41 to −1.28 |
| Ashley Moody (small sample) | 16 | 12 | +40.76 | +45.64 | −4.88 | −15.76 to +8.20 |
| Julie Johnson | 96 | 72 | −2.36 | +3.03 | −5.39 | −9.14 to −1.89 |
| J. French Hill (small sample) | 4 | 3 | −15.07 | −9.43 | −5.64 | −6.59 to −5.10 |
| Scott Franklin | 67 | 29 | −18.99 | −12.54 | −6.45 | −11.24 to −1.99 |
| Richard Blumenthal (small sample) | 1 | 1 | −68.85 | −62.35 | −6.51 | Single security |
| Debbie Wasserman Schultz (small sample) | 9 | 9 | +58.03 | +64.77 | −6.74 | −33.14 to +20.19 |
| Neal P. Dunn (small sample) | 1 | 1 | −71.01 | −64.10 | −6.91 | Single security |
| Dwight Evans (small sample) | 5 | 5 | +43.97 | +52.31 | −8.35 | −24.12 to +0.99 |
| Ritchie Torres | 62 | 60 | −7.55 | +2.41 | −9.96 | −15.81 to −3.85 |
| John J. McGuire III (small sample) | 4 | 4 | −62.96 | −44.96 | −18.00 | −47.46 to −3.13 |
| Mike Kelly (small sample) | 1 | 1 | −71.63 | −47.95 | −23.67 | Single security |
| Michael A. Rulli (small sample) | 1 | 1 | −21.80 | +24.53 | −46.33 | Single security |
No matching rows. Clear the filter to see all records.
Paired common exits; each row weights that member’s purchases equally. Per-member intervals resample securities. Fewer than 20 purchases is marked as a small sample; one security has no cluster interval. All values are price-return differences in percentage points.
Shorter horizons use different matured cohorts
The same common-exit method is repeated at 21, 63 and 126 market sessions. Purchases only qualify when the public entry occurs before that shared exit. A long disclosure delay can therefore exclude a purchase from a short-horizon comparison. The rows below are different cohorts, not the evolution of one portfolio.
Show the table · 4 rows, 5 columns
Scroll sideways to compare all columns. Select a heading to sort.
| 21 sessions | 7796 | 81 | −0.13 | −0.37 to +0.15 |
| 63 sessions | 11879 | 92 | −0.19 | −0.60 to +0.08 |
| 126 sessions | 11112 | 91 | −0.47 | −0.78 to −0.06 |
| 252 sessions | 8385 | 86 | −0.27 | −0.86 to +0.20 |
No matching rows. Clear the filter to see all records.
Earlier minus public excess return; negative values favor public entry. See the full study JSON for equal-member weighting and calendar-month-cluster sensitivity.
Inspect the shorter-horizon politician tables
21-session politician detail
Show the table · 81 rows, 7 columns
Scroll sideways to compare all columns. Select a heading to sort.
| Michael Guest (small sample) | 1 | 1 | +25.35 | −1.44 | +26.79 | Single security |
| W. Gregory Steube (small sample) | 2 | 2 | +17.64 | +2.41 | +15.23 | +0.59 to +29.87 |
| Laurel M. Lee (small sample) | 2 | 2 | +17.64 | +2.81 | +14.83 | −1.48 to +31.13 |
| Tina Smith (small sample) | 1 | 1 | +13.87 | +0.09 | +13.78 | Single security |
| Stephen F. Lynch (small sample) | 1 | 1 | +21.96 | +8.42 | +13.53 | Single security |
| Nancy Pelosi (small sample) | 3 | 2 | +8.63 | +0.76 | +7.87 | +1.41 to +20.77 |
| Richard Blumenthal (small sample) | 1 | 1 | +4.87 | −1.85 | +6.72 | Single security |
| Victoria Spartz (small sample) | 6 | 1 | +4.79 | −0.08 | +4.88 | Single security |
| Chip Roy (small sample) | 1 | 1 | −7.10 | −11.79 | +4.68 | Single security |
| Debbie Dingell (small sample) | 2 | 2 | +6.62 | +2.03 | +4.59 | +1.61 to +7.58 |
| John Fetterman (small sample) | 9 | 6 | +6.99 | +3.07 | +3.92 | +0.40 to +9.13 |
| Angus S. King, Jr. (small sample) | 2 | 2 | +4.22 | +0.90 | +3.32 | −4.69 to +11.32 |
| Ed Case (small sample) | 2 | 1 | +4.90 | +1.73 | +3.18 | Single security |
| Jared Moskowitz (small sample) | 13 | 6 | +2.98 | +0.25 | +2.73 | −4.28 to +7.31 |
| Morgan McGarvey (small sample) | 3 | 3 | +4.11 | +1.71 | +2.39 | −4.68 to +14.48 |
| Roger Williams (small sample) | 2 | 2 | −1.81 | −3.49 | +1.68 | −4.13 to +7.49 |
| Judy Chu (small sample) | 2 | 1 | −4.72 | −6.32 | +1.59 | Single security |
| Nicole Malliotakis (small sample) | 2 | 2 | −2.24 | −3.60 | +1.36 | −2.36 to +5.08 |
| Brian J. Mast (small sample) | 3 | 2 | +2.73 | +1.42 | +1.31 | −0.82 to +2.37 |
| Jefferson Shreve | 80 | 76 | +1.06 | −0.22 | +1.28 | −1.04 to +3.30 |
| Robert P. Bresnahan, Jr. | 108 | 64 | +2.02 | +0.86 | +1.17 | −1.93 to +4.33 |
| Markwayne Mullin | 116 | 66 | +1.13 | +0.01 | +1.12 | −0.88 to +3.25 |
| Byron Donalds | 40 | 17 | −1.60 | −2.59 | +0.99 | −0.99 to +3.23 |
| Thomas R. Suozzi (small sample) | 1 | 1 | −1.71 | −2.67 | +0.96 | Single security |
| Tim Moore | 65 | 15 | +3.62 | +2.71 | +0.91 | −2.87 to +4.98 |
| David J. Taylor | 124 | 28 | +1.41 | +0.54 | +0.87 | −0.20 to +1.98 |
| Robert E. Latta (small sample) | 14 | 1 | +1.29 | +0.50 | +0.79 | Single security |
| Josh Gottheimer | 215 | 103 | +1.27 | +0.50 | +0.77 | −0.57 to +2.13 |
| Shelley Moore Capito (small sample) | 19 | 12 | +4.18 | +3.46 | +0.72 | −2.70 to +3.73 |
| John W. Hickenlooper (small sample) | 2 | 2 | +1.36 | +0.72 | +0.64 | −12.53 to +13.80 |
| Pete Sessions (small sample) | 8 | 4 | +0.41 | −0.16 | +0.57 | −1.59 to +2.35 |
| Ashley Moody (small sample) | 7 | 7 | +2.35 | +1.78 | +0.56 | −9.82 to +12.82 |
| Doug Lamborn (small sample) | 6 | 1 | +0.30 | −0.26 | +0.56 | Single security |
| Julia Letlow (small sample) | 6 | 6 | +1.46 | +0.91 | +0.55 | −3.33 to +4.84 |
| James Comer | 29 | 24 | +1.42 | +1.00 | +0.42 | −2.77 to +5.22 |
| Marjorie Taylor Greene | 379 | 78 | +0.38 | −0.01 | +0.38 | −0.12 to +0.93 |
| Rick W. Allen (small sample) | 5 | 5 | +0.59 | +0.21 | +0.38 | −4.77 to +6.49 |
| Val T. Hoyle (small sample) | 1 | 1 | −4.16 | −4.40 | +0.24 | Single security |
| Kevin Hern | 37 | 19 | +1.28 | +1.04 | +0.24 | −1.67 to +1.71 |
| William R. Keating (small sample) | 13 | 10 | −1.31 | −1.33 | +0.02 | −1.92 to +1.59 |
| Gilbert Ray Cisneros, Jr. | 561 | 283 | −0.15 | −0.11 | −0.04 | −1.07 to +1.05 |
| Dan Newhouse | 32 | 30 | −0.10 | +0.01 | −0.11 | −1.73 to +1.46 |
| Jonathan L. Jackson (small sample) | 17 | 15 | −0.51 | −0.39 | −0.12 | −4.83 to +4.43 |
| Ro Khanna | 4256 | 531 | −0.48 | −0.34 | −0.14 | −0.46 to +0.17 |
| Michael A. Rulli (small sample) | 1 | 1 | +0.81 | +0.97 | −0.16 | Single security |
| Keith Self (small sample) | 2 | 2 | −4.37 | −4.17 | −0.20 | −0.28 to −0.12 |
| Jim Banks (small sample) | 2 | 2 | −5.37 | −5.12 | −0.25 | −1.82 to +1.31 |
| Lisa C. McClain | 214 | 184 | −0.01 | +0.28 | −0.29 | −1.38 to +0.78 |
| Kathy E. Manning | 47 | 20 | −1.41 | −1.07 | −0.34 | −1.92 to +1.00 |
| John Boozman | 54 | 34 | −0.61 | −0.19 | −0.42 | −4.15 to +2.29 |
| Rick Larsen | 22 | 22 | +1.91 | +2.43 | −0.52 | −2.32 to +1.23 |
| Michael T. McCaul | 465 | 117 | −1.03 | −0.48 | −0.55 | −1.67 to +0.57 |
| Lloyd Doggett | 42 | 6 | −0.65 | −0.06 | −0.59 | −2.11 to +1.18 |
| Cleo Fields | 207 | 31 | +1.50 | +2.19 | −0.70 | −3.53 to +0.92 |
| Julie Johnson | 65 | 50 | +0.58 | +1.32 | −0.73 | −3.98 to +2.53 |
| Virginia Foxx | 51 | 14 | −1.10 | −0.25 | −0.85 | −1.73 to +0.12 |
| John James (small sample) | 1 | 1 | +3.07 | +3.94 | −0.87 | Single security |
| Charles J. "Chuck" Fleischmann (small sample) | 4 | 4 | +0.56 | +1.54 | −0.98 | −7.21 to +3.35 |
| Tony Wied (small sample) | 19 | 15 | −0.33 | +0.66 | −0.99 | −6.45 to +4.05 |
| Earl Blumenauer (small sample) | 8 | 5 | −0.61 | +0.86 | −1.48 | −5.25 to +2.29 |
| Thomas R. Carper (small sample) | 15 | 14 | −1.88 | −0.27 | −1.60 | −5.18 to +1.82 |
| Richard McCormick (small sample) | 14 | 8 | −2.42 | −0.78 | −1.64 | −5.46 to +1.80 |
| April McClain Delaney | 173 | 30 | −2.12 | −0.37 | −1.75 | −2.92 to −0.49 |
| Maria Elvira Salazar | 35 | 22 | −2.17 | −0.29 | −1.88 | −5.04 to +1.18 |
| Gary C. Peters (small sample) | 9 | 9 | +1.16 | +3.12 | −1.97 | −5.14 to +1.32 |
| Vicente Gonzalez (small sample) | 3 | 2 | +2.28 | +4.30 | −2.02 | −3.31 to +0.56 |
| Debbie Wasserman Schultz (small sample) | 7 | 7 | −5.32 | −3.24 | −2.09 | −13.78 to +8.75 |
| Michael C. Burgess (small sample) | 6 | 3 | −1.94 | +0.20 | −2.14 | −7.15 to +0.06 |
| Dwight Evans (small sample) | 6 | 5 | −0.95 | +1.23 | −2.17 | −7.01 to +1.12 |
| Scott Franklin | 45 | 18 | −0.69 | +1.52 | −2.21 | −4.71 to +0.35 |
| Mitch McConnell (small sample) | 9 | 1 | −1.53 | +0.80 | −2.33 | Single security |
| Thomas H. Kean, Jr. | 26 | 20 | −4.47 | −1.71 | −2.76 | −5.39 to −0.08 |
| Jerry Moran (small sample) | 1 | 1 | −8.64 | −5.66 | −2.98 | Single security |
| Bruce Westerman (small sample) | 6 | 6 | −3.33 | +0.55 | −3.88 | −9.60 to +1.52 |
| Kelly Morrison (small sample) | 5 | 2 | −7.52 | −1.94 | −5.58 | −7.77 to −2.29 |
| John J. McGuire III (small sample) | 9 | 7 | −7.81 | −1.70 | −6.11 | −11.04 to −2.27 |
| Tommy Tuberville (small sample) | 9 | 7 | +3.22 | +9.44 | −6.23 | −11.68 to +1.94 |
| Sheldon Whitehouse (small sample) | 8 | 8 | −10.50 | −4.25 | −6.25 | −12.08 to −0.43 |
| Greg Landsman (small sample) | 5 | 4 | −4.31 | +2.77 | −7.07 | −12.47 to −1.35 |
| Daniel Meuser (small sample) | 1 | 1 | −31.35 | −18.20 | −13.15 | Single security |
| Pete Stauber (small sample) | 1 | 1 | −30.34 | −0.65 | −29.68 | Single security |
No matching rows. Clear the filter to see all records.
Paired common exits; each row weights that member’s purchases equally. Per-member intervals resample securities. Fewer than 20 purchases is marked as a small sample; one security has no cluster interval. All values are price-return differences in percentage points.
63-session politician detail
Show the table · 92 rows, 7 columns
Scroll sideways to compare all columns. Select a heading to sort.
| W. Gregory Steube (small sample) | 2 | 2 | +30.09 | +11.59 | +18.49 | +0.70 to +36.29 |
| Ron Wyden (small sample) | 1 | 1 | +21.72 | +4.45 | +17.27 | Single security |
| Stephen F. Lynch (small sample) | 1 | 1 | +25.34 | +11.16 | +14.18 | Single security |
| Tina Smith (small sample) | 1 | 1 | +7.89 | −5.30 | +13.18 | Single security |
| Chip Roy (small sample) | 2 | 1 | −16.86 | −27.04 | +10.18 | Single security |
| John Fetterman (small sample) | 9 | 6 | +22.77 | +15.76 | +7.00 | +0.08 to +21.08 |
| Brad Knott (small sample) | 2 | 1 | −17.34 | −23.89 | +6.55 | Single security |
| Terri A. Sewell (small sample) | 2 | 2 | +11.93 | +5.66 | +6.28 | −1.05 to +13.61 |
| Laurel M. Lee (small sample) | 4 | 3 | −8.58 | −14.19 | +5.62 | −13.77 to +18.84 |
| Debbie Dingell (small sample) | 2 | 2 | −3.50 | −8.12 | +4.62 | +0.98 to +8.26 |
| Victoria Spartz (small sample) | 6 | 1 | −0.56 | −5.08 | +4.52 | Single security |
| Jerry Moran (small sample) | 5 | 1 | +12.58 | +10.24 | +2.34 | Single security |
| Morgan McGarvey (small sample) | 6 | 6 | +3.41 | +1.29 | +2.12 | −3.48 to +9.10 |
| Markwayne Mullin | 151 | 71 | +2.57 | +0.58 | +2.00 | −0.09 to +4.22 |
| Kelly Morrison (small sample) | 10 | 3 | +16.00 | +14.17 | +1.84 | −5.62 to +8.89 |
| Roger Williams (small sample) | 2 | 2 | +2.32 | +0.60 | +1.72 | −4.05 to +7.50 |
| Nancy Pelosi (small sample) | 2 | 1 | +5.51 | +3.87 | +1.64 | Single security |
| David J. Taylor | 112 | 29 | +1.84 | +0.27 | +1.58 | +0.10 to +3.11 |
| Michael Guest (small sample) | 5 | 5 | +8.39 | +6.89 | +1.50 | −22.31 to +23.94 |
| Brian J. Mast (small sample) | 3 | 2 | +1.92 | +0.59 | +1.33 | −0.88 to +2.44 |
| Katie Boyd Britt (small sample) | 2 | 2 | +7.53 | +6.30 | +1.24 | −6.87 to +9.35 |
| Robert P. Bresnahan, Jr. | 247 | 167 | +0.63 | −0.53 | +1.17 | −0.72 to +3.07 |
| Earl Blumenauer (small sample) | 13 | 10 | +0.73 | −0.35 | +1.08 | −1.89 to +5.20 |
| Kathy E. Manning | 85 | 30 | −1.02 | −1.86 | +0.84 | −0.97 to +2.58 |
| Pete Sessions (small sample) | 9 | 5 | −0.67 | −1.40 | +0.74 | −0.99 to +2.30 |
| Nicole Malliotakis (small sample) | 2 | 2 | −6.71 | −7.41 | +0.70 | −2.41 to +3.81 |
| Bruce Westerman | 84 | 77 | −0.70 | −1.38 | +0.68 | −1.41 to +2.80 |
| James Comer | 29 | 24 | −4.46 | −5.14 | +0.68 | −1.93 to +4.85 |
| Robert E. Latta (small sample) | 14 | 1 | +4.46 | +3.80 | +0.66 | Single security |
| Maria Elvira Salazar | 61 | 33 | −0.03 | −0.66 | +0.63 | −3.08 to +4.87 |
| William R. Keating (small sample) | 15 | 12 | +2.96 | +2.34 | +0.62 | −1.21 to +2.11 |
| John James (small sample) | 4 | 4 | −2.88 | −3.49 | +0.62 | −3.86 to +7.22 |
| Jefferson Shreve | 189 | 147 | −0.43 | −1.00 | +0.57 | −0.87 to +2.06 |
| Thomas R. Suozzi (small sample) | 1 | 1 | −12.50 | −13.04 | +0.54 | Single security |
| Kevin Hern | 49 | 21 | −0.25 | −0.75 | +0.50 | −0.94 to +1.81 |
| Judy Chu (small sample) | 2 | 1 | −16.25 | −16.70 | +0.45 | Single security |
| Val T. Hoyle (small sample) | 19 | 17 | −2.77 | −3.21 | +0.44 | −7.56 to +9.33 |
| Doug Lamborn (small sample) | 6 | 1 | +2.22 | +1.80 | +0.42 | Single security |
| Richard McCormick | 39 | 25 | +3.35 | +2.94 | +0.41 | −1.78 to +2.97 |
| Marjorie Taylor Greene | 379 | 78 | +1.47 | +1.09 | +0.38 | −0.11 to +0.91 |
| Byron Donalds | 82 | 30 | +0.69 | +0.44 | +0.26 | −4.07 to +5.90 |
| Michael T. McCaul | 827 | 136 | −1.62 | −1.88 | +0.26 | −0.81 to +1.41 |
| Tim Moore | 116 | 22 | +6.84 | +6.63 | +0.21 | −2.68 to +4.30 |
| John Boozman | 84 | 49 | +4.33 | +4.27 | +0.06 | −2.90 to +2.78 |
| Gilbert Ray Cisneros, Jr. | 816 | 343 | +0.57 | +0.57 | −0.00 | −1.01 to +0.99 |
| John W. Hickenlooper (small sample) | 5 | 5 | −4.71 | −4.70 | −0.00 | −8.22 to +8.32 |
| Keith Self (small sample) | 2 | 2 | −0.54 | −0.51 | −0.04 | −0.32 to +0.24 |
| Ro Khanna | 6089 | 554 | −1.03 | −0.88 | −0.15 | −0.51 to +0.23 |
| Josh Gottheimer | 320 | 140 | −0.64 | −0.46 | −0.17 | −1.45 to +1.19 |
| Thomas R. Carper (small sample) | 16 | 15 | +0.72 | +1.00 | −0.28 | −4.25 to +3.69 |
| Ed Case (small sample) | 2 | 1 | +1.47 | +1.83 | −0.36 | Single security |
| Jonathan L. Jackson | 55 | 40 | −0.60 | −0.21 | −0.39 | −2.84 to +2.31 |
| Lloyd Doggett | 53 | 6 | −3.14 | −2.74 | −0.39 | −1.36 to +0.90 |
| Jim Banks (small sample) | 2 | 2 | −15.68 | −15.24 | −0.44 | −1.99 to +1.12 |
| Rick Larsen | 22 | 22 | +0.29 | +0.84 | −0.54 | −2.33 to +1.16 |
| Carol D. Miller (small sample) | 9 | 9 | −11.41 | −10.87 | −0.55 | −3.92 to +2.63 |
| Dan Newhouse | 53 | 51 | −5.57 | −4.94 | −0.63 | −2.41 to +1.01 |
| Mitch McConnell (small sample) | 10 | 1 | +0.19 | +0.97 | −0.78 | Single security |
| Jared Moskowitz | 182 | 65 | +2.80 | +3.60 | −0.80 | −2.75 to +0.90 |
| Scott Franklin | 43 | 19 | −3.83 | −2.86 | −0.98 | −4.53 to +2.85 |
| Cleo Fields | 214 | 31 | +4.88 | +5.91 | −1.03 | −4.64 to +0.89 |
| Angus S. King, Jr. | 24 | 24 | +2.38 | +3.47 | −1.09 | −4.72 to +2.44 |
| Thomas H. Kean, Jr. | 61 | 30 | −1.06 | +0.13 | −1.19 | −4.17 to +1.73 |
| Tony Wied | 28 | 17 | +2.01 | +3.20 | −1.20 | −7.60 to +4.08 |
| Virginia Foxx | 63 | 14 | +3.74 | +4.95 | −1.21 | −2.77 to +0.04 |
| April McClain Delaney | 188 | 34 | −6.76 | −5.50 | −1.26 | −2.57 to +0.09 |
| Rick W. Allen (small sample) | 17 | 15 | −1.10 | +0.16 | −1.27 | −6.26 to +2.84 |
| Charles J. "Chuck" Fleischmann (small sample) | 9 | 8 | −6.77 | −5.42 | −1.35 | −6.50 to +3.05 |
| Shelley Moore Capito | 26 | 15 | +3.79 | +5.39 | −1.60 | −5.35 to +1.27 |
| Julie Johnson | 78 | 54 | +2.72 | +4.36 | −1.64 | −4.27 to +0.93 |
| August Pfluger (small sample) | 5 | 5 | −5.48 | −3.74 | −1.74 | −5.95 to +2.74 |
| Ashley Moody (small sample) | 16 | 12 | +1.89 | +3.64 | −1.75 | −9.66 to +7.56 |
| Lisa C. McClain | 634 | 408 | −1.71 | +0.10 | −1.81 | −2.72 to −0.92 |
| Gary C. Peters (small sample) | 9 | 9 | +2.78 | +4.66 | −1.87 | −5.05 to +1.40 |
| Ritchie Torres (small sample) | 1 | 1 | −11.73 | −9.41 | −2.33 | Single security |
| Michael C. Burgess (small sample) | 6 | 3 | −8.61 | −6.26 | −2.35 | −8.06 to +0.12 |
| Greg Landsman (small sample) | 19 | 14 | −2.18 | +0.29 | −2.47 | −6.76 to +1.50 |
| Vicente Gonzalez (small sample) | 3 | 2 | +11.62 | +14.27 | −2.65 | −4.17 to +0.40 |
| Dwight Evans (small sample) | 6 | 5 | +7.02 | +9.75 | −2.73 | −7.94 to +1.03 |
| Debbie Wasserman Schultz (small sample) | 9 | 9 | +4.85 | +8.35 | −3.49 | −14.56 to +7.36 |
| Julia Letlow | 28 | 26 | −7.35 | −3.47 | −3.89 | −8.70 to +0.20 |
| Cliff Bentz (small sample) | 2 | 2 | −11.57 | −6.87 | −4.70 | −8.00 to −1.39 |
| J. French Hill (small sample) | 4 | 3 | −11.08 | −6.03 | −5.04 | −6.01 to −4.44 |
| Tommy Tuberville | 31 | 25 | −5.41 | +0.01 | −5.42 | −9.82 to −0.75 |
| Sheldon Whitehouse (small sample) | 11 | 10 | −4.17 | +1.74 | −5.91 | −11.32 to −0.28 |
| John J. McGuire III (small sample) | 12 | 9 | −13.69 | −4.57 | −9.12 | −21.22 to −1.01 |
| Richard Blumenthal (small sample) | 1 | 1 | +2.48 | +15.45 | −12.97 | Single security |
| Michael A. Rulli (small sample) | 5 | 4 | −9.10 | +5.21 | −14.31 | −36.60 to +0.55 |
| Daniel Meuser (small sample) | 1 | 1 | −25.80 | −11.37 | −14.43 | Single security |
| Neal P. Dunn (small sample) | 1 | 1 | −11.61 | +11.11 | −22.72 | Single security |
| Pete Stauber (small sample) | 1 | 1 | −16.81 | +20.58 | −37.39 | Single security |
| Mike Kelly (small sample) | 1 | 1 | −36.37 | +4.23 | −40.60 | Single security |
No matching rows. Clear the filter to see all records.
Paired common exits; each row weights that member’s purchases equally. Per-member intervals resample securities. Fewer than 20 purchases is marked as a small sample; one security has no cluster interval. All values are price-return differences in percentage points.
126-session politician detail
Show the table · 91 rows, 7 columns
Scroll sideways to compare all columns. Select a heading to sort.
| Ron Wyden (small sample) | 1 | 1 | +2.21 | −14.85 | +17.06 | Single security |
| Stephen F. Lynch (small sample) | 1 | 1 | +42.20 | +25.49 | +16.71 | Single security |
| W. Gregory Steube (small sample) | 2 | 2 | +8.53 | −4.39 | +12.92 | +0.88 to +24.97 |
| Brad Knott (small sample) | 2 | 1 | −3.00 | −12.60 | +9.60 | Single security |
| Terri A. Sewell (small sample) | 2 | 2 | +25.05 | +16.80 | +8.25 | +0.41 to +16.10 |
| Tina Smith (small sample) | 1 | 1 | −33.52 | −41.52 | +8.00 | Single security |
| Chip Roy (small sample) | 1 | 1 | −32.33 | −39.79 | +7.46 | Single security |
| Jerry Moran (small sample) | 4 | 1 | +64.58 | +57.33 | +7.25 | Single security |
| John Fetterman (small sample) | 9 | 6 | +28.43 | +21.33 | +7.10 | +0.31 to +19.70 |
| Debbie Dingell (small sample) | 2 | 2 | +5.07 | −0.32 | +5.38 | +1.91 to +8.86 |
| Victoria Spartz (small sample) | 6 | 1 | +0.13 | −4.59 | +4.73 | Single security |
| Kelly Morrison (small sample) | 10 | 3 | +26.23 | +23.39 | +2.83 | −4.13 to +11.66 |
| Markwayne Mullin | 153 | 71 | +5.63 | +2.85 | +2.79 | −0.17 to +5.98 |
| Laurel M. Lee (small sample) | 4 | 3 | −23.50 | −26.27 | +2.78 | −11.94 to +12.17 |
| Michael Guest (small sample) | 5 | 5 | +23.44 | +20.87 | +2.57 | −23.33 to +28.47 |
| John James (small sample) | 15 | 11 | +0.11 | −2.06 | +2.17 | −3.53 to +6.75 |
| David J. Taylor | 91 | 28 | −1.77 | −3.93 | +2.15 | +0.39 to +4.16 |
| Maria Elvira Salazar | 38 | 26 | −2.43 | −4.54 | +2.10 | −3.02 to +8.27 |
| Byron Donalds | 80 | 29 | +1.33 | −0.47 | +1.80 | −2.81 to +8.22 |
| Brian J. Mast (small sample) | 3 | 2 | +6.39 | +4.75 | +1.64 | −1.00 to +2.96 |
| Nancy Pelosi (small sample) | 2 | 1 | +1.88 | +0.37 | +1.51 | Single security |
| Morgan McGarvey (small sample) | 6 | 6 | +8.17 | +6.68 | +1.49 | −3.66 to +6.84 |
| James Comer | 29 | 24 | +5.04 | +3.68 | +1.36 | −2.62 to +8.15 |
| Robert P. Bresnahan, Jr. | 247 | 167 | −3.10 | −4.33 | +1.23 | −0.89 to +3.35 |
| Earl Blumenauer (small sample) | 13 | 10 | −0.18 | −1.18 | +1.01 | −1.98 to +5.10 |
| Kathy E. Manning | 85 | 30 | −3.48 | −4.20 | +0.72 | −1.15 to +2.41 |
| Nicole Malliotakis (small sample) | 2 | 2 | −0.63 | −1.33 | +0.71 | −3.10 to +4.51 |
| Gary C. Peters (small sample) | 4 | 4 | −6.90 | −7.57 | +0.67 | −3.10 to +4.45 |
| Jefferson Shreve | 189 | 147 | −2.32 | −2.91 | +0.59 | −1.01 to +2.28 |
| Richard McCormick | 34 | 25 | −2.07 | −2.64 | +0.57 | −2.04 to +3.62 |
| Doug Lamborn (small sample) | 6 | 1 | −3.41 | −3.97 | +0.56 | Single security |
| Pete Sessions (small sample) | 9 | 5 | −0.50 | −0.99 | +0.49 | −1.16 to +1.82 |
| William R. Keating (small sample) | 15 | 12 | −2.89 | −3.33 | +0.44 | −1.04 to +1.86 |
| Marjorie Taylor Greene | 379 | 78 | +3.45 | +3.07 | +0.38 | −0.17 to +0.98 |
| Bruce Westerman | 84 | 77 | −1.30 | −1.67 | +0.37 | −1.96 to +2.74 |
| Kevin Hern | 49 | 21 | −2.25 | −2.60 | +0.35 | −1.17 to +1.73 |
| Robert E. Latta (small sample) | 12 | 1 | +2.89 | +2.64 | +0.25 | Single security |
| Thomas R. Suozzi (small sample) | 1 | 1 | −18.05 | −18.29 | +0.23 | Single security |
| Roger Williams (small sample) | 3 | 3 | −3.68 | −3.89 | +0.21 | −4.58 to +7.02 |
| John Boozman | 77 | 44 | +5.99 | +5.81 | +0.18 | −3.74 to +3.50 |
| Keith Self (small sample) | 2 | 2 | +2.53 | +2.38 | +0.15 | −0.77 to +1.06 |
| Judy Chu (small sample) | 2 | 1 | −16.32 | −16.40 | +0.08 | Single security |
| Gilbert Ray Cisneros, Jr. | 671 | 316 | −1.98 | −2.02 | +0.04 | −1.15 to +1.28 |
| Tim Moore | 113 | 21 | +6.24 | +6.20 | +0.04 | −3.06 to +4.73 |
| Katie Boyd Britt (small sample) | 2 | 2 | −10.15 | −10.05 | −0.10 | −7.09 to +6.89 |
| John W. Hickenlooper (small sample) | 5 | 5 | −22.06 | −21.94 | −0.11 | −8.11 to +7.75 |
| Rick W. Allen (small sample) | 13 | 12 | −3.12 | −2.89 | −0.23 | −5.49 to +3.88 |
| Charles J. "Chuck" Fleischmann (small sample) | 8 | 7 | −2.28 | −1.99 | −0.29 | −5.70 to +4.69 |
| Jim Banks (small sample) | 2 | 2 | −5.77 | −5.46 | −0.31 | −2.01 to +1.40 |
| Michael T. McCaul | 728 | 128 | −5.05 | −4.73 | −0.32 | −1.58 to +1.14 |
| Dan Newhouse | 41 | 41 | −1.78 | −1.36 | −0.42 | −2.72 to +1.95 |
| Carol D. Miller (small sample) | 9 | 9 | −18.49 | −18.07 | −0.43 | −3.98 to +2.91 |
| Rick Larsen | 20 | 20 | −6.25 | −5.77 | −0.48 | −2.49 to +1.61 |
| Thomas R. Carper (small sample) | 16 | 15 | −10.31 | −9.82 | −0.49 | −4.46 to +3.59 |
| Ro Khanna | 5340 | 546 | −3.80 | −3.26 | −0.54 | −0.99 to −0.05 |
| Jared Moskowitz | 166 | 61 | +1.51 | +2.28 | −0.77 | −2.82 to +1.02 |
| Tony Wied | 22 | 16 | −0.43 | +0.43 | −0.86 | −7.78 to +6.05 |
| April McClain Delaney | 140 | 30 | −14.23 | −13.25 | −0.98 | −2.66 to +0.87 |
| Cleo Fields | 205 | 30 | +2.77 | +3.76 | −0.99 | −4.67 to +1.03 |
| Scott Franklin | 43 | 19 | −9.56 | −8.56 | −1.00 | −4.80 to +3.09 |
| Thomas H. Kean, Jr. | 51 | 25 | +1.35 | +2.39 | −1.04 | −4.34 to +2.27 |
| Lloyd Doggett | 47 | 6 | −5.94 | −4.88 | −1.06 | −2.21 to +0.52 |
| Josh Gottheimer | 304 | 132 | −1.08 | +0.00 | −1.08 | −2.34 to +0.20 |
| Virginia Foxx | 62 | 14 | −4.48 | −3.31 | −1.17 | −2.73 to +0.10 |
| Lisa C. McClain | 647 | 414 | −1.37 | +0.02 | −1.39 | −2.49 to −0.25 |
| Julie Johnson | 77 | 53 | +3.64 | +5.39 | −1.74 | −5.02 to +1.29 |
| August Pfluger (small sample) | 5 | 5 | −5.51 | −3.76 | −1.75 | −6.07 to +2.65 |
| Greg Landsman | 22 | 15 | −2.90 | −1.08 | −1.82 | −5.71 to +2.20 |
| Val T. Hoyle | 47 | 39 | −4.83 | −2.93 | −1.90 | −8.84 to +4.77 |
| Shelley Moore Capito | 26 | 15 | +10.71 | +12.64 | −1.93 | −6.35 to +1.19 |
| Angus S. King, Jr. | 24 | 24 | −0.51 | +1.51 | −2.03 | −6.23 to +1.87 |
| Julia Letlow | 46 | 44 | −6.93 | −4.78 | −2.16 | −7.00 to +2.85 |
| Vicente Gonzalez (small sample) | 3 | 2 | +14.83 | +17.03 | −2.19 | −3.88 to +1.17 |
| Sheldon Whitehouse (small sample) | 9 | 8 | +2.01 | +4.50 | −2.49 | −6.71 to +3.27 |
| Ashley Moody (small sample) | 16 | 12 | +8.03 | +10.52 | −2.49 | −11.40 to +8.57 |
| Michael C. Burgess (small sample) | 6 | 3 | −18.53 | −15.92 | −2.60 | −8.03 to +0.01 |
| Mitch McConnell (small sample) | 9 | 1 | −0.69 | +1.93 | −2.62 | Single security |
| Alan Armstrong | 340 | 321 | −5.75 | −3.08 | −2.66 | −5.84 to +0.87 |
| Ritchie Torres (small sample) | 2 | 2 | +11.15 | +13.85 | −2.70 | −4.66 to −0.74 |
| Debbie Wasserman Schultz (small sample) | 9 | 9 | +7.82 | +10.75 | −2.93 | −14.42 to +8.94 |
| Jonathan L. Jackson | 78 | 44 | −8.46 | −5.43 | −3.03 | −6.81 to +0.68 |
| Ed Case (small sample) | 2 | 1 | +1.07 | +5.20 | −4.13 | Single security |
| Cliff Bentz (small sample) | 2 | 2 | −13.90 | −9.40 | −4.51 | −7.93 to −1.08 |
| Dwight Evans (small sample) | 6 | 5 | +22.38 | +27.25 | −4.87 | −14.69 to +1.10 |
| J. French Hill (small sample) | 4 | 3 | −0.78 | +4.22 | −5.00 | −6.07 to −4.32 |
| Tommy Tuberville | 31 | 25 | −6.86 | −1.57 | −5.29 | −9.92 to −0.44 |
| John J. McGuire III (small sample) | 9 | 7 | −15.32 | −6.54 | −8.78 | −27.47 to +2.28 |
| Richard Blumenthal (small sample) | 1 | 1 | +7.61 | +21.75 | −14.14 | Single security |
| Neal P. Dunn (small sample) | 1 | 1 | +10.10 | +43.98 | −33.88 | Single security |
| Pete Stauber (small sample) | 1 | 1 | −26.44 | +7.47 | −33.90 | Single security |
| Mike Kelly (small sample) | 1 | 1 | −53.14 | −18.47 | −34.67 | Single security |
No matching rows. Clear the filter to see all records.
Paired common exits; each row weights that member’s purchases equally. Per-member intervals resample securities. Fewer than 20 purchases is marked as a small sample; one security has no cluster interval. All values are price-return differences in percentage points.
How the study was measured
Read the explanation
Quiver’s quoted claim concerns its own weighted, weekly-rebalanced strategy and an earlier reporting window. This study measures excess price returns and isolates entry timing in a broader stock-purchase sample; it is not a replication of that strategy or a test of its stated historical return.
The transaction cohort starts January 1, 2024. Canonical economic event IDs consolidate repeated reports. The main analysis uses the latest version available before October 22, 2026, with a first-reported-version sensitivity. Stock and ADR identity is confirmed at the transaction date through historical security segments, then followed across ticker changes. Options, option-linked exercises, other instruments, missing identities and invalid dates are excluded.
Prices are split-adjusted and exclude dividends. Fees, taxes, position limits and risk adjustment are outside these event returns. Neither entry is the politician’s reported execution price: the first uses hindsight and the second conservatively assumes the filing becomes available at New York end of day.
For each arm, stock price return is exit price divided by entry price, minus one. Subtract SPY’s price return over those exact same dates. Subtract the public arm’s excess return from the earlier arm’s excess return to obtain the timing gap. Pre-entry cash is not modeled.
A pair must have both entry prices, an exit after both entries, exact-date SPY prices and consistent market-session coverage. The latest full price session was checked against the median ticker coverage of the preceding 20 sessions. Prices run through October 21, 2026; the latest filing date in the selected cohort is October 19, 2026. The annual transaction dates span January 2, 2024 through October 20, 2025.
Missing terminal prices, delistings, halts or immature horizons can exclude events. Delisting payouts are not reconstructed, so coverage and survivorship selection remain possible. Results describe the resolved, priced cohort. They do not establish that earlier knowledge never matters, that an individual lacks skill, or that an options strategy has the same result.
Aggregate and delay intervals use 4,000 politician-cluster bootstrap resamples with a fixed seed. Per-politician intervals resample stocks. Shared stocks, overlapping trades and market exposure still limit independence. Multiple member comparisons are not adjusted for selection; historical rankings are descriptive.
Check the sensitivity and reproduce the figures
Using first-reported versions changes the annual mean timing gap to −0.28 points. Moving the earlier entry to the following session changes it to −0.34 points. The study JSON includes the full paired fixed-horizon comparison, common-exit results, equal-member weighting, month-cluster intervals and exclusions.
The independent audit checked all 44,539 fixed-horizon rows and 39,172 common-exit rows against frozen raw price endpoints, benchmark ratios, date boundaries and group summaries. Query hashes, source receipts and executable analysis are retained with the research project. The downloads contain derived observations and results; no credentials or private account data are included.
Inspect a disclosure at its source
A timing estimate starts with a dated filing and a correctly identified security. Browse the original reports or inspect how NexusTrade turns congressional disclosures into research inputs before interpreting a member’s result.
No comments yet.