TL;DR
Concentrating a ten-year dividend-growth screen into its five largest companies raised January 2022 to October 6, 2026 returns from 32.43% to 134.94%, versus matched SPY's 72.41%. Recent drawdown reached 24.33%, above the broad basket's 13.22% and SPY's 19.92%. The January 2014 start returned 340.90% versus SPY's 414.21%. Growth and dividend income differed: the five-stock book received less recent dividend cash. This is an independent NexusTrade experiment, not Sure Dividend's portfolio.
- Five stocks, 2022 start
- 134.94% return
- Broad basket
- 32.43% return
- Holding SPY
- 72.41% return
- Five-stock recent decline
- 24.33%
From the broad basket to five stocks
- Five-stock experiment 2026-10-06, 16:00:00 EDT
- 134.94
- Broad dividend basket 2026-10-06, 16:00:00 EDT
- 32.43
- Holding SPY 2026-10-06, 16:00:00 EDT
- 72.41
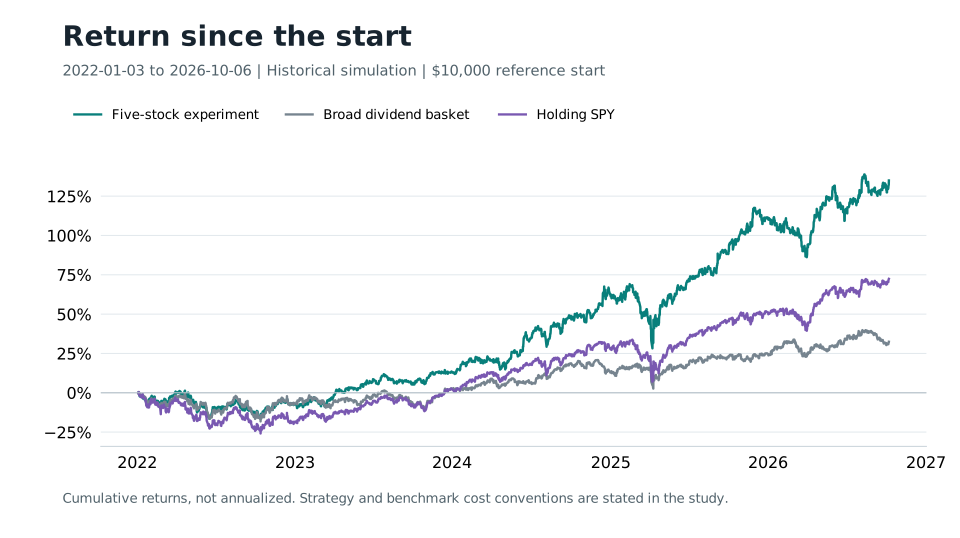
Cumulative return (%)
Use the line buttons to compare the strategy with its recorded controls. Then switch to drawdown to inspect the losses behind the return.
- First recorded mark
- Jan 3, 2022 · 09:30:00 NY
- Last recorded mark
- Oct 6, 2026 · 16:00:00 NY
- Vertical axis range (percent)
- -25.87 to 138.79
At the recorded endpoint: Five-stock experiment 134.94%; Broad dividend basket 32.43%; Holding SPY 72.41%. These are cumulative returns over this window, not annual rates.
- Five-stock experiment 2026-10-06, 16:00:00 EDT
- -1.61
- Broad dividend basket 2026-10-06, 16:00:00 EDT
- -5.29
- Holding SPY 2026-10-06, 16:00:00 EDT
- 0
Below the prior peak (%)
Choose the lines whose losses you want to compare. Hiding a line changes this view only; the recorded dates and chart scale stay fixed.
- First recorded mark
- Jan 3, 2022 · 09:30:00 NY
- Last recorded mark
- Oct 6, 2026 · 16:00:00 NY
- Vertical axis range (percent)
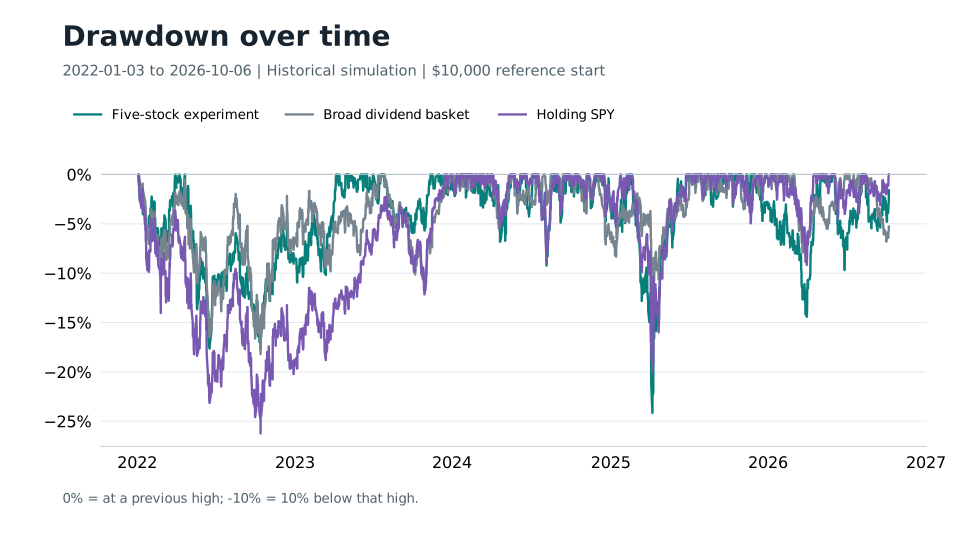
- -26.24 to 0.00
Zero is a prior high; -10 means 10% below that book’s prior peak. Compare losses over the same recorded window; these marks do not measure every intraday extreme.
Concentration raised returns and recent risk
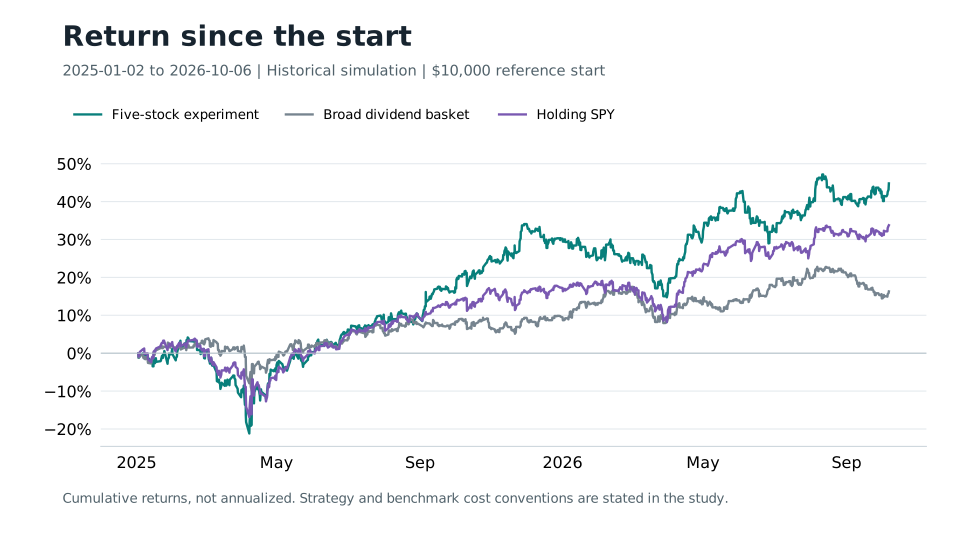
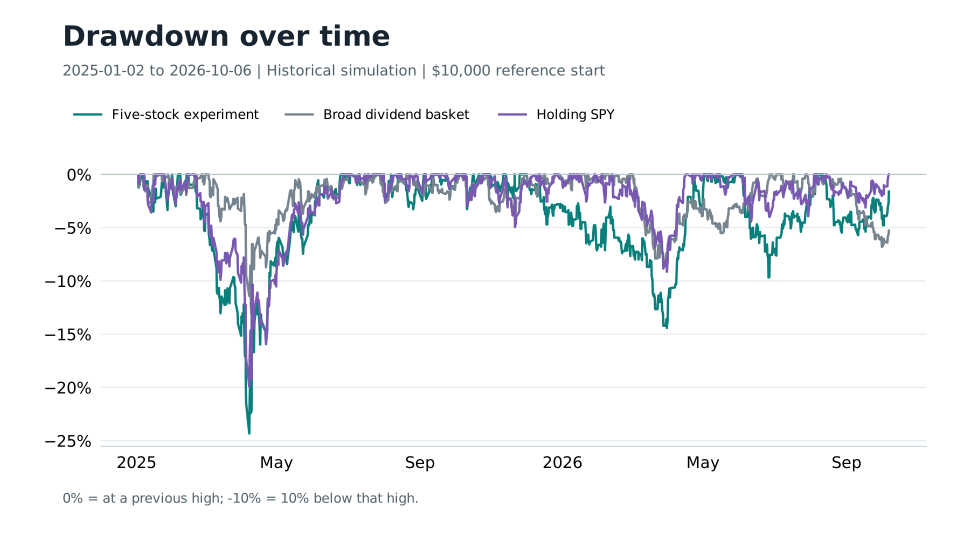
The broad dividend basket returned 32.43% from January 3, 2022 to October 6, 2026. Selecting its five largest companies by market capitalization raised the after-fee return to 134.94%, against 72.41% for the matched SPY holding book. That improvement came with more concentration: the recent five-stock drawdown was 24.33%, versus 13.22% for the broad basket and 19.92% for SPY.
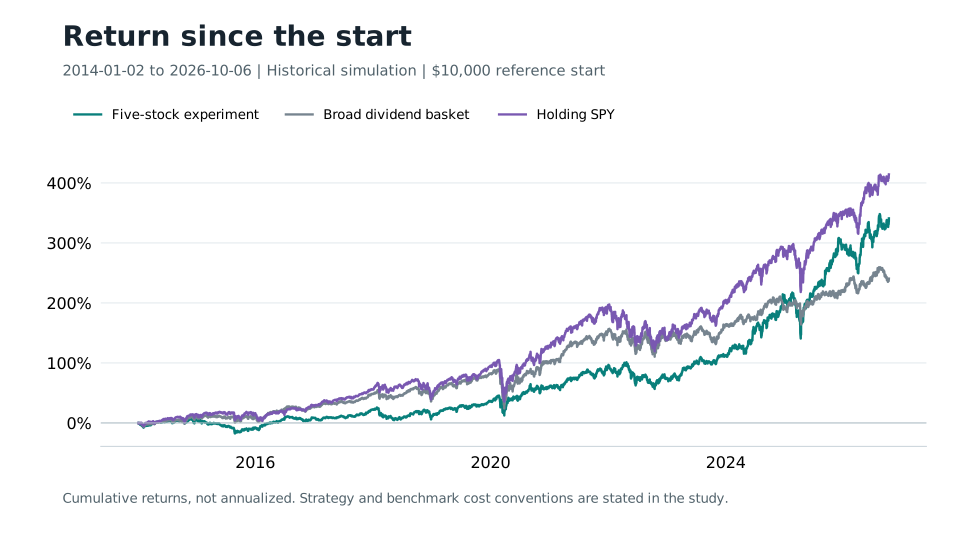
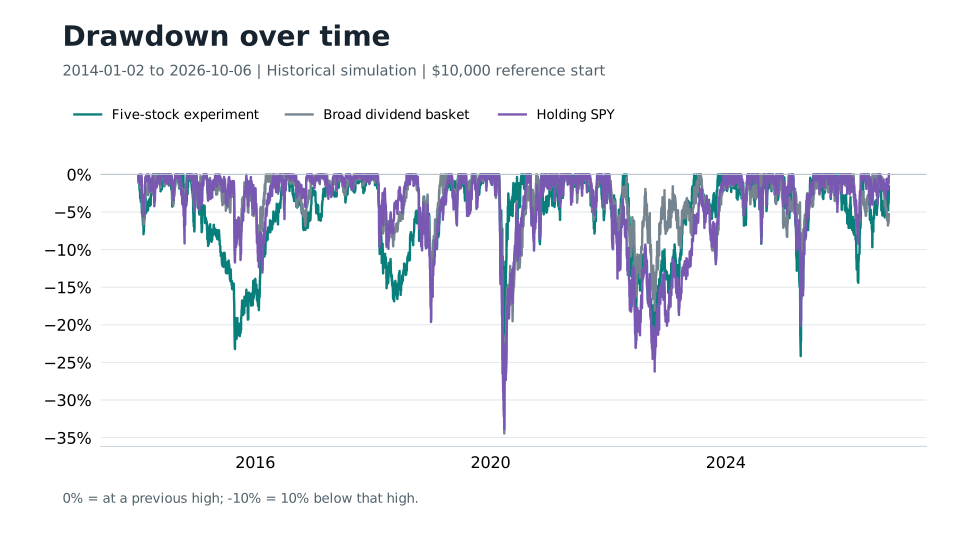
The longer 2014 start tells a less flattering story. Five stocks returned 340.90%, above the broad basket's 240.53% but below SPY's 414.21%. The five-stock book also received less cumulative dividend cash in the recent test. Faster portfolio growth and greater dividend income are different outcomes.
This was an independent NexusTrade experiment offered to Ben Reynolds and the Sure Dividend team for inspection. It predates our source-fit review and is not a replica of their portfolio or a claim that they supplied these rules. Their current blue-chip article, authored by Nikolaos Sismanis, uses 25 years of increases, an A risk grade and expected-return rankings. This experiment uses ten years and market capitalization.
The recent cost of concentration
- Five-stock experiment 2026-10-06, 16:00:00 EDT
- 44.8
- Broad dividend basket 2026-10-06, 16:00:00 EDT
- 16.3
- Holding SPY 2026-10-06, 16:00:00 EDT
- 33.76
Cumulative return (%)
Use the line buttons to compare the strategy with its recorded controls. Then switch to drawdown to inspect the losses behind the return.
- First recorded mark
- Jan 2, 2025 · 09:30:00 NY
- Last recorded mark
- Oct 6, 2026 · 16:00:00 NY
- Vertical axis range (percent)
- -21.18 to 47.17
At the recorded endpoint: Five-stock experiment 44.80%; Broad dividend basket 16.30%; Holding SPY 33.76%. These are cumulative returns over this window, not annual rates.
- Five-stock experiment 2026-10-06, 16:00:00 EDT
- -1.61
- Broad dividend basket 2026-10-06, 16:00:00 EDT
- -5.29
- Holding SPY 2026-10-06, 16:00:00 EDT
- 0
Below the prior peak (%)
Choose the lines whose losses you want to compare. Hiding a line changes this view only; the recorded dates and chart scale stay fixed.
- First recorded mark
- Jan 2, 2025 · 09:30:00 NY
- Last recorded mark
- Oct 6, 2026 · 16:00:00 NY
- Vertical axis range (percent)
- -24.33 to 0.00
Zero is a prior high; -10 means 10% below that book’s prior peak. Compare losses over the same recorded window; these marks do not measure every intraday extreme.
The exact dividend screen
Show the table · 5 rows, 2 columns
| Setting | Tested value |
|---|---|
| Capital and execution | $10,000 fresh start; fractional shares; 1.5% execution reserve. |
| Fees | 0.1% per stock fill; dividend-reinvestment fees also retained. |
| Dividends | Paid cash dividends reinvested according to the native portfolio policy; entitlement and payment timing audited. |
| Holding comparison | Fresh native SPY book under the matched fee, reserve and dividend convention. |
| Additional costs | No additional spread, market impact or tax model. |
No matching rows. Clear the filter to see all records.
Start with the point-in-time S&P 500 universe. Keep companies whose closing regular dividend per share increased in at least ten consecutive completed New York calendar years. Compare each year's closing dividend rate, not its sum of payments. Special dividends are excluded and regular dividends are split-adjusted. A company with no paid dividend has no eligible dividend value.
The broad control equally weights every eligible company. The independent five-stock adaptation keeps the five eligible companies with the highest as-of market capitalization and weights them equally. The stored strategy uses a 30-day filled-buy timer; it is not labeled a first-trading-day monthly rebalance.
ConsecutiveIncrease(LastDividend(CANDIDATE), "Year", 10) >= 10
Independent adaptation: select the five highest as-of market capitalizations.
All three start dates
Show the table · 3 rows, 4 columns
Scroll sideways to compare all columns. Select a heading to sort.
| Jan 2, 2014 to Oct 6, 2026 | 240.53% / 34.46% | 340.90% / 24.16% | 414.21% / 33.87% |
| Jan 3, 2022 to Oct 6, 2026 | 32.43% / 18.20% | 134.94% / 24.16% | 72.41% / 26.24% |
| Jan 2, 2025 to Oct 6, 2026 | 16.30% / 13.22% | 44.80% / 24.33% | 33.76% / 19.92% |
No matching rows. Clear the filter to see all records.
Cumulative return / maximum drawdown across audited market and history marks. Daily-close-only drawdown is smaller and is not substituted for these headline values.
The longer history where SPY won
- Five-stock experiment 2026-10-06, 16:00:00 EDT
- 340.9
- Broad dividend basket 2026-10-06, 16:00:00 EDT
- 240.53
- Holding SPY 2026-10-06, 16:00:00 EDT
- 414.21
Cumulative return (%)
Use the line buttons to compare the strategy with its recorded controls. Then switch to drawdown to inspect the losses behind the return.
- First recorded mark
- Jan 2, 2014 · 09:30:00 NY
- Last recorded mark
- Oct 6, 2026 · 16:00:00 NY
- Vertical axis range (percent)
- -17.60 to 414.21
At the recorded endpoint: Five-stock experiment 340.90%; Broad dividend basket 240.53%; Holding SPY 414.21%. These are cumulative returns over this window, not annual rates.
- Five-stock experiment 2026-10-06, 16:00:00 EDT
- -1.61
- Broad dividend basket 2026-10-06, 16:00:00 EDT
- -5.29
- Holding SPY 2026-10-06, 16:00:00 EDT
- 0
Below the prior peak (%)
Choose the lines whose losses you want to compare. Hiding a line changes this view only; the recorded dates and chart scale stay fixed.
- First recorded mark
- Jan 2, 2014 · 09:30:00 NY
- Last recorded mark
- Oct 6, 2026 · 16:00:00 NY
- Vertical axis range (percent)
- -34.46 to 0.00
Zero is a prior high; -10 means 10% below that book’s prior peak. Compare losses over the same recorded window; these marks do not measure every intraday extreme.
Dividend data had to be repaired before using the numbers
Early investigations found dividend-accounting and entitlement issues. Those preliminary paths were held while the underlying defects were repaired. This study uses the retained post-entitlement audits and fresh SPY comparisons after the ETF repair, not the invalid earlier numbers.
The recorded accounting checks support the historical measurements. Keep the weaker periods and concentration visible when judging the strategy.
A useful experiment, not Sure Dividend's portfolio
Inspect the request
Sure Dividend's published framework considers risk, valuation and expected returns, and Ben Reynolds has discussed substantially broader diversification. The ten-year top-five model omits those analyst judgments. A collaboration would need the creator's own approved rules before a portfolio could be presented as theirs.
The listed book provides an editable research example. It has no claimed forward performance or realized subscription revenue. All these periods and variants were inspected during development. The next evaluation should preserve the broad basket and SPY controls, concentration risk and weaker long-history growth.
Detailed measurement and provenance notes
Read the full accounting, source and execution assumptions
The final local audit reconstructed cash, quantities and NAV from actual fills, market prices and paid dividends. Its maximum reconciliation errors were below $0.000001, and the observed source-payment audit found no missing payments. Full market-mark drawdown was checked independently against native statistics. This accounting check supports the reported historical measurements; it does not certify the future safety of any company or a complete independent reproduction from new raw data.
No comments yet.