TL;DR
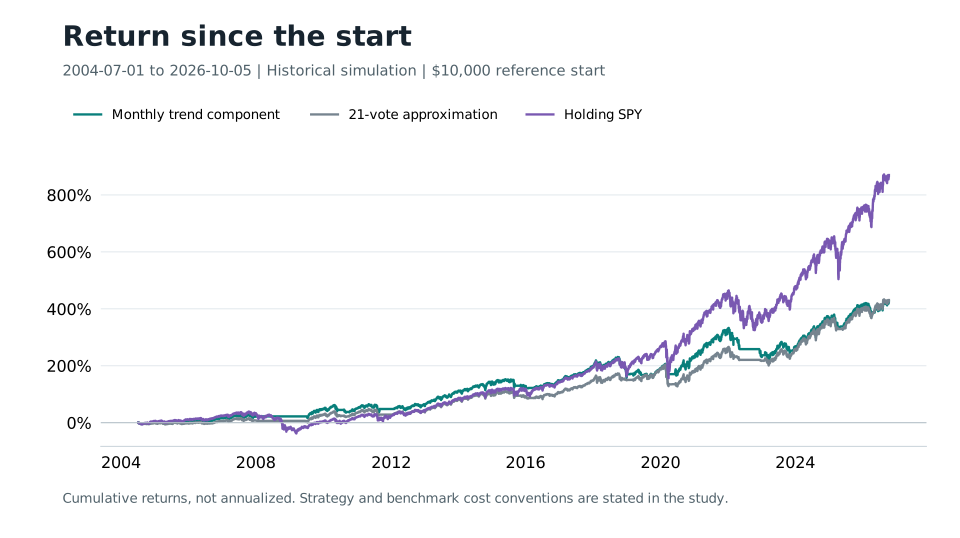
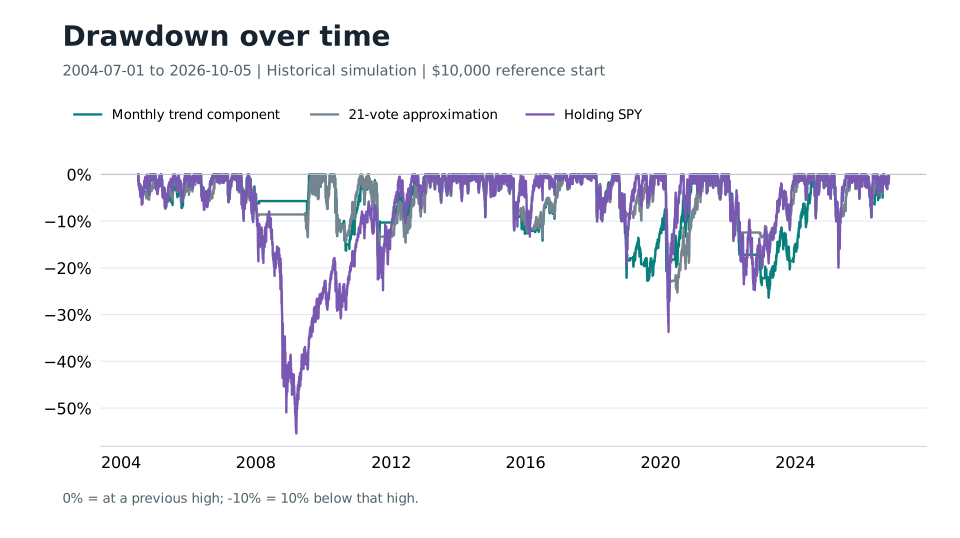
The monthly SPY trend component reduced the worst observed drawdown to 26.38% versus holding SPY's 55.43%, but returned 425.98% versus 869.87% from July 2004 through October 5, 2026. A fresh 2025 start returned 13.84% versus 33.65%. Actual trades showed delays from both the signal and the monthly schedule. This failed adaptation is one component, not Hoffstein's complete staggered portfolio; strategy dividends stay cash while the holding benchmark reinvests them.
- Monthly adaptation, 2004 start
- 425.98% return
- Holding SPY
- 869.87% return
- Adaptation drawdown
- 26.38%
- Recent adaptation return
- 13.84%
The full historical comparison
- Monthly trend component 2026-10-05, 16:00:00 EDT
- 425.98
- 21-vote approximation 2026-10-05, 16:00:00 EDT
- 430.65
- Holding SPY 2026-10-05, 16:00:00 EDT
- 869.87
Cumulative return (%)
Use the line buttons to compare the strategy with its recorded controls. Then switch to drawdown to inspect the losses behind the return.
- First recorded mark
- Jul 1, 2004 · 09:30:00 NY
- Last recorded mark
- Oct 5, 2026 · 16:00:00 NY
- Vertical axis range (percent)
- -37.99 to 872.10
At the recorded endpoint: Monthly trend component 425.98%; 21-vote approximation 430.65%; Holding SPY 869.87%. These are cumulative returns over this window, not annual rates.
- Monthly trend component 2026-10-05, 16:00:00 EDT
- -0.47
- 21-vote approximation 2026-10-05, 16:00:00 EDT
- -0.47
- Holding SPY 2026-10-05, 16:00:00 EDT
- -0.23
Below the prior peak (%)
Choose the lines whose losses you want to compare. Hiding a line changes this view only; the recorded dates and chart scale stay fixed.
- First recorded mark
- Jul 1, 2004 · 09:30:00 NY
- Last recorded mark
- Oct 5, 2026 · 16:00:00 NY
- Vertical axis range (percent)
- -55.43 to 0.00
Zero is a prior high; -10 means 10% below that book’s prior peak. Compare losses over the same recorded window; these marks do not measure every intraday extreme.
Less drawdown, too much missed return
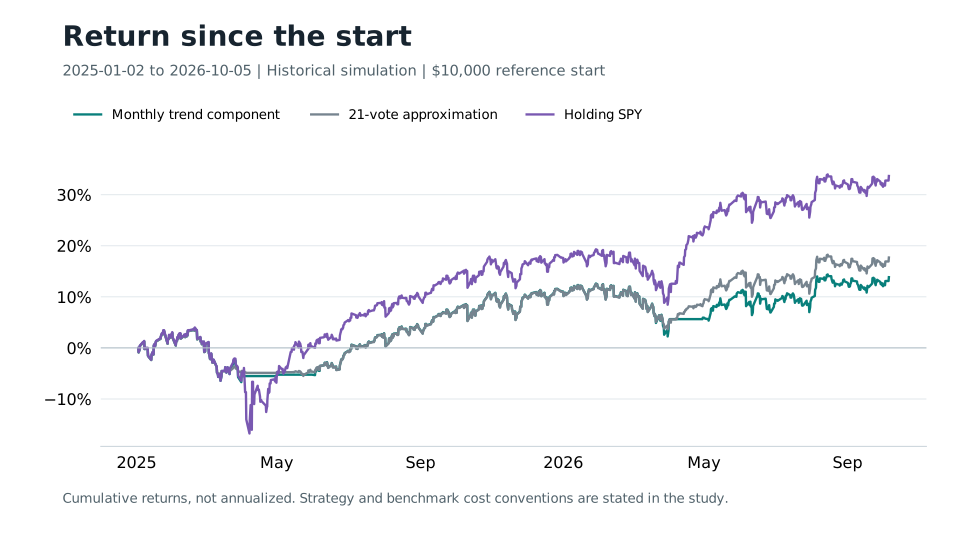
From July 1, 2004 to October 5, 2026, the monthly SPY trend component returned 425.98% after modeled fees against 869.87% for holding SPY. Its largest observed decline was 26.38% versus 55.43%. Over a fresh January 2025 start, it returned 13.84% against SPY's 33.65%. Lower exposure reduced drawdown, but the return shortfall was too large for this creator outreach package.
Corey Hoffstein's 2013 article, The Luck of the Rebalance Timing, studies the timing sensitivity of Meb Faber's ten-month trend model. Our created portfolio implements one calendar-month component. It does not reproduce Hoffstein's complete staggered portfolio, and the failure does not disprove that source design.
Where the actual trades went wrong
Read the explanation
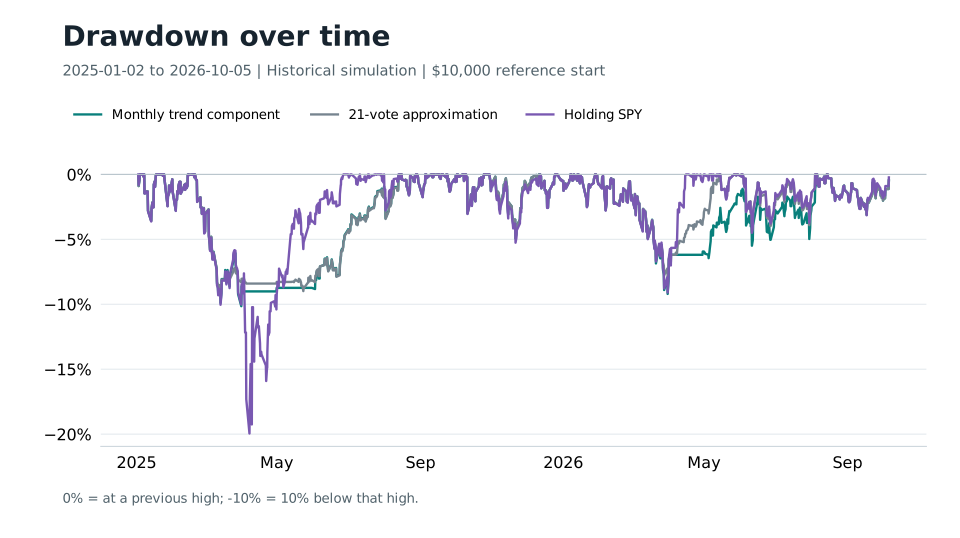
The event review separated two problems: a slow signal and waiting for the monthly trading date after that signal had changed. In early 2019, SPY had already risen 11.79% from the January exit before the existing daily version of the signal became positive on February 13. Another 1.98% rise followed before monthly reentry. Changing the calendar cannot recover gains that happened while the signal was still negative.
In April 2026 the existing signal first turned positive on April 8 at $676.01, while the monthly book stayed in cash until May 1 and paid $721.25. The 6.69% intervening price rise illustrates additional waiting after a positive signal. In November 2023, 5.81% followed the first positive signal before December reentry. These are observed asset-price changes with the original book held fixed, not estimates of a revised portfolio's return.
Partial staggered transitions are a source-backed next hypothesis: Hoffstein discusses independent sleeves and a four-sleeve weekly implementation. The completed vote approximation is negative evidence against assuming timing alone will rescue the pitch. An exact sleeve reproduction would need its own declared signal definitions and complete test.
The published idea and our implementation
Show the table · 5 rows, 2 columns
| Part | Definition |
|---|---|
| Source timing study | Twenty-one offset strategies, each updating every 21 trading days; prior-close signals and next-opening trades. |
| Source diversified version | One twenty-first in each separately drifting sleeve; restore equal capital annually. |
| Created monthly component | Compare the completed month-end SPY close with the arithmetic mean of that close and the prior nine month-end closes: above means invested; otherwise cash. Trade at the first following session opening. |
| 21-vote diagnostic | Average recent signal votes into one target. It is an approximation, not independently drifting source sleeves. |
| Costs and distributions | $10,000; fractional shares; 0.1% per fill; strategy dividends as cash; no idle interest. SPY benchmark reinvests dividends without trading fees. |
No matching rows. Clear the filter to see all records.
The source's calendar and sleeve mechanics matter. The calendar-month component and daily vote approximation are identified separately.
The longer and recent tests
Show the table · 2 rows, 4 columns
Scroll sideways to compare all columns. Select a heading to sort.
| Jul 1, 2004 to Oct 5, 2026 | 425.98% | 430.65% | 869.87% |
| Jan 2, 2025 to Oct 5, 2026 | 13.84% | 17.69% | 33.65% |
No matching rows. Clear the filter to see all records.
Cumulative returns after strategy fees. The vote approximation improved its own control but did not fix the broad or recent market shortfall.
The recent rebound problem
- Monthly trend component 2026-10-05, 16:00:00 EDT
- 13.84
- 21-vote approximation 2026-10-05, 16:00:00 EDT
- 17.69
- Holding SPY 2026-10-05, 16:00:00 EDT
- 33.65
Cumulative return (%)
Use the line buttons to compare the strategy with its recorded controls. Then switch to drawdown to inspect the losses behind the return.
- First recorded mark
- Jan 2, 2025 · 09:30:00 NY
- Last recorded mark
- Oct 5, 2026 · 16:00:00 NY
- Vertical axis range (percent)
- -16.75 to 33.96
At the recorded endpoint: Monthly trend component 13.84%; 21-vote approximation 17.69%; Holding SPY 33.65%. These are cumulative returns over this window, not annual rates.
- Monthly trend component 2026-10-05, 16:00:00 EDT
- -0.47
- 21-vote approximation 2026-10-05, 16:00:00 EDT
- -0.47
- Holding SPY 2026-10-05, 16:00:00 EDT
- -0.23
Below the prior peak (%)
Choose the lines whose losses you want to compare. Hiding a line changes this view only; the recorded dates and chart scale stay fixed.
- First recorded mark
- Jan 2, 2025 · 09:30:00 NY
- Last recorded mark
- Oct 5, 2026 · 16:00:00 NY
- Vertical axis range (percent)
- -19.95 to 0.00
Zero is a prior high; -10 means 10% below that book’s prior peak. Compare losses over the same recorded window; these marks do not measure every intraday extreme.
What remains unresolved
The audit verified 268 monthly rebalance signals. Some first-day chart marks are not opening-price execution records; inspect the separate order tape when comparing fills.
The results document an unsuccessful adaptation with a defensive effect. The created book stays a research experiment. No winning replacement or new forward record is claimed. All historical periods were inspected during development and are not untouched out-of-sample evidence.
Detailed measurement and provenance notes
Read the full accounting, source and execution assumptions
The broad audit verified 268 monthly rebalance signals. Eighteen first-day curve snapshots used a 9:00 Eastern mark rather than an eligible 9:30 opening, and one had only a closing snapshot. Separate order records were inspected where present. Those curve timestamps should not be presented as a certified complete opening-price tape.
No comments yet.