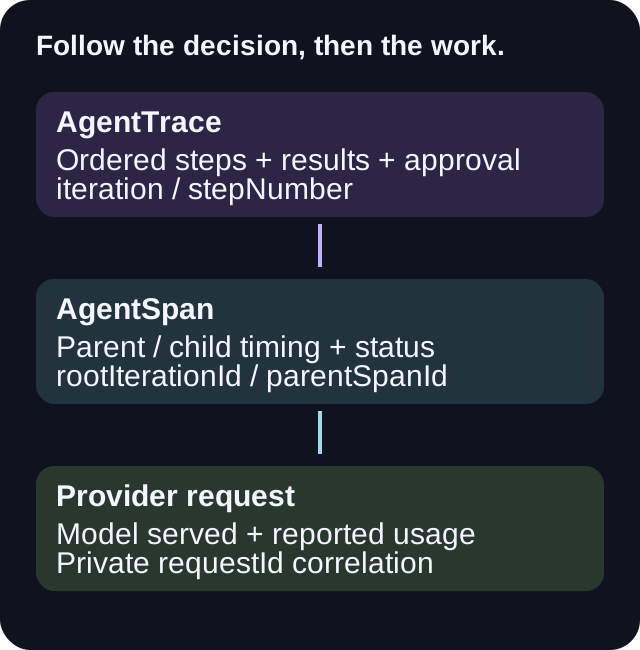
Three records answer different questions
Inspect an existing Aurora run
Open the execution trace
Open your own agent in Aurora. Use the timeline icon labeled View Execution Trace on its status card. Opening it reads the run; it does not send a message or restart work.
Follow the Timeline
Group steps by iteration. Expand the decision, then its action execution and result. Compare what the agent requested with what the tool returned, including errors and approval steps.
Check timing in Sequence and Gantt
The trace dialog has Timeline, Sequence and Gantt tabs. Use them to locate the slow step, then inspect its model-call count, usage and result. A correct final answer alone cannot tell you where time went.
Read your own trajectory without starting work
In the browser developer console on nexustrade.io, replace YOUR_OWN_AGENT_ID with an agent ID from your own open run. This same-origin GET uses your signed-in session. It does not invoke a tool, run inference or change the agent. If it returns no rows, verify the account and run before assuming nothing happened.
const agentId = 'YOUR_OWN_AGENT_ID';
const response = await fetch('/api/agent/traces/' + encodeURIComponent(agentId) + '/trajectory', { credentials: 'same-origin' });
if (!response.ok) throw new Error('Trace read failed: ' + response.status);
const trajectory = await response.json();
console.log({ traceCount: trajectory.traceCount, returnedRows: trajectory.traces.length });
Run the local example
Download and run
Save trace-review.mjs, then run it with Node.js. With no filename it checks three illustrative steps using an included assertion. It makes no network request.
Read the result
The fixture has 140ms of summed step time, three known model calls, one step with unknown call count, 550 reported tokens and $0.002 reported cost. Two steps lack cost. These are teaching values, not a production run.
Use a private export locally
If you already saved your own trajectory response to private-trajectory.json, supply that filename. The output keeps only known step types and numeric metrics. Keep the raw file off public repositories and shared screenshots.
node trace-review.mjs
# Optional: inspect a trajectory you already exported locally
node trace-review.mjs private-trajectory.json
What the reader leaves out
The download creates a new allowlisted summary. It does not copy agentId, userId, conversationId, plan, thought, action input, resultSummary, error text or arbitrary metadata. Those fields can contain customer requests, resource IDs, account details or credentials even when a trace looks harmless.
Its reportedCostUsd is the sum of known values, with a missing-cost count beside it. Zero cost is a valid observed number; an absent cost is unknown. In NexusTrade's StepMetrics contract, modelCalls equal to zero means the caller did not report its round count. Token counts need the same care: a step can aggregate several inner model rounds, and zero tokens may mean usage was not reported.
Instrument the boundaries, not just the final answer
NexusTrade keeps ordered AgentTrace records for decisions, executions, results, state transitions and approvals. SpanRecorder adds nested timed work: orchestration, LLM, tool, database, external API, compute, persistence and wait spans. A child inherits its parent and iteration through AsyncLocalStorage.
The stepper records decide.build_prompt and decide.llm_call separately. The LLM span includes the requested model, retry number, prompt name and requestId. Tool spans use execute.tool followed by the tool name, then retain returned-message count and reported model and cost when available.
The snippet below is an adaptation of that source pattern for application code that already has an initialized recorder and provider client. It is not a public API or a standalone download. Use a non-sensitive request correlation key; do not place prompts, passwords or full response bodies in span attributes.
const answer = await recorder.withSpan(
  { name: 'decide.llm_call', kind: SpanKind.LLM,
    attributes: { model: requestedModel, retry: retryNumber, requestId } },
  async (span) => {
    const result = await callModel();
    if (result.usage?.costUsd !== undefined) {
      span.setAttribute('costUsd', result.usage.costUsd);
    }
    if (result.usage?.modelUsed) {
      span.setAttribute('modelUsed', result.usage.modelUsed);
    }
    return result;
  },
);
Avoid these debugging mistakes
Adding parents and children
Nested spans overlap. Their duration sum double-counts work. Use the start-to-end interval or critical path for wall time, and report summed work separately.
Confusing requested and served models
A retry or fallback can serve a different model. Keep requested model, actual model, request correlation and billing source together when comparing latency or cost.
Treating an error as the whole story
A recoverable error may be followed by a successful retry. Follow later steps and terminal status. Conversely, a plausible answer does not establish that the requested artifact was produced.
Assuming a missing span means no work
Span persistence is best effort so telemetry failure does not break the main action. The source also has an AGENT_SPANS_ENABLED kill switch. A missing span requires a visibility check.
Keep agent traces separate from trading events
The AgentTrace and AgentSpan schemas inspected for this guide do not declare a TTL. That is a code fact, not a promise of permanent availability. Raw backtest event traces are a different store with a three-day retention window; they describe simulated trading activity, not the LLM's decision loop.
A public benchmark should publish reviewed aggregates and authored examples. Replay fixtures made from real conversations stay private unless separately approved. Freeze prompt and context versions for evaluations instead of treating a live trace as a reproducible benchmark.