TL;DR
AInvest executed the January 2 to March 20, 2025 SPY simulation and a 50% sizing variant, returning checked daily reports of -3.2755% and -1.6378%. Drawdown was 10.0354% and 5.1362%, so its narrative claim of exact halving was wrong. An earlier NexusTrade Aurora attempt changed the interval and entry condition and omitted final value. A fresh production rerun now preserves the requested daily configuration and returns $9,672.45; detailed order events were disabled. Compare request fidelity and returned evidence; different account tiers and unverified configurations prevent a matched performance or speed ranking.
AInvest executed the SPY request and a one-rule sizing change
Portfolio value (USD)
- 100% SPY 2025-03-20
- $9,672.45
- 50% SPY + $5,000 cash 2025-03-20
- $9,836.22
100% SPY: 10.04% largest decline in plotted observations. 2025-02-19 ($10,483.89) to 2025-03-13 ($9,431.79).
Show the table · 7 rows, 3 columns
Scroll sideways to compare all columns. Select a heading to sort.
| January 2 to March 20, 2025 | 53 daily marks | The same 53 source closes |
| Initial portfolio / entry price | $10,000 / $584.64 | $10,000 / $584.64 |
| Entry shares, displayed | 17.104543 | 8.552271 |
| Ending cash / portfolio value | $0 / $9,672.45 | $5,000 / $9,836.22 |
| Total return | -3.2755% | -1.6378% |
| Maximum decline from a prior peak | 10.0354% | 5.1362% |
| Drawdown trough | March 13, 2025 | March 13, 2025 |
No matching rows. Clear the filter to see all records.
Actual AIME assistant-executed Python simulations on FinQuery daily closes, observed October 13, 2026 on Free Plan. Both use fractional shares, zero commission/slippage and no end liquidation. These are downloaded report values; independent arithmetic checks passed.
Read the explanation
We asked AIME to buy SPY once at the January 2 regular-market close and hold through March 20. Its visible trace fetched daily OHLC and ran Python. It corrected an initial script error and returned a numerical result. One follow-up asked for the saved artifacts and changed only the invested fraction from 100% to 50%. AIME reran both versions and delivered the full report.
Every stored equity mark matched an independent calculation to within half a cent, and both reports used identical source closes. The 50% version equals $5,000 cash plus half the baseline portfolio. Its percentage drawdown is 5.1362%, rather than exactly half of 10.0354%, because the running equity peak also changes. AIME's table was correct; its narrative incorrectly described that drawdown as halved. Its original narrative also dated the approximately $10,484 equity peak February 26. The saved curve peaks February 19 at $10,483.89; February 26 is $10,169.33. These are narrative errors against its own report, while the stored numeric series passes the arithmetic checks.
The full report required that follow-up; the first response supplied a filename in prose. The downloaded file wrapped JSON in Markdown, so reproducing it required extracting the report block. The code and data downloads were not independently recovered in this audit. The report supports this completed daily-stock research loop; native engine runtime and historical price-source certification were not measured.
date,source_close_usd,100_percent_equity_usd,50_percent_equity_usd
2025-01-02,584.64,10000.00,10000.00
2025-01-03,591.95,10125.03,10062.52
2025-01-06,595.36,10183.36,10091.68
2025-01-07,588.63,10068.25,10034.12
2025-01-08,589.49,10082.96,10041.48
2025-01-10,580.49,9929.02,9964.51
2025-01-13,581.39,9944.41,9972.21
2025-01-14,582.19,9958.09,9979.05
2025-01-15,592.78,10139.23,10069.62
2025-01-16,591.64,10119.73,10059.87
2025-01-17,597.58,10221.33,10110.67
2025-01-21,603.05,10314.89,10157.45
2025-01-22,606.44,10372.88,10186.44
2025-01-23,609.75,10429.50,10214.75
2025-01-24,607.97,10399.05,10199.52
2025-01-27,599.37,10251.95,10125.97
2025-01-28,604.52,10340.04,10170.02
2025-01-29,601.81,10293.69,10146.84
2025-01-30,605.04,10348.93,10174.47
2025-01-31,601.82,10293.86,10146.93
2025-02-03,597.77,10224.58,10112.29
2025-02-04,601.78,10293.17,10146.59
2025-02-05,604.22,10334.91,10167.45
2025-02-06,606.32,10370.83,10185.41
2025-02-07,600.77,10275.90,10137.95
2025-02-10,604.85,10345.68,10172.84
2025-02-11,605.31,10353.55,10176.78
2025-02-12,603.36,10320.20,10160.10
2025-02-13,609.73,10429.15,10214.58
2025-02-14,609.70,10428.64,10214.32
2025-02-18,611.49,10459.26,10229.63
2025-02-19,612.93,10483.89,10241.94
2025-02-20,610.38,10440.27,10220.14
2025-02-21,599.94,10261.70,10130.85
2025-02-24,597.21,10215.00,10107.50
2025-02-25,594.24,10164.20,10082.10
2025-02-26,594.54,10169.33,10084.67
2025-02-27,585.05,10007.01,10003.51
2025-02-28,594.18,10163.18,10081.59
2025-03-03,583.77,9985.12,9992.56
2025-03-04,576.86,9866.93,9933.46
2025-03-05,583.06,9972.97,9986.49
2025-03-06,572.71,9795.94,9897.97
2025-03-07,575.92,9850.85,9925.42
2025-03-10,560.58,9588.46,9794.23
2025-03-11,555.92,9508.76,9754.38
2025-03-12,558.87,9559.22,9779.61
2025-03-13,551.42,9431.79,9715.89
2025-03-14,562.81,9626.61,9813.30
2025-03-17,567.15,9700.84,9850.42
2025-03-18,561.02,9595.99,9798.00
2025-03-19,567.13,9700.50,9850.25
2025-03-20,565.49,9672.45,9836.22
The same daily request exposed a NexusTrade workflow mismatch
Show the table · 7 rows, 3 columns
Scroll sideways to compare all columns. Select a heading to sort.
| Account used | Free Plan | Staff account with comped Wall Street Elite |
| Requested dates / interval | January 2 to March 20, 2025 / daily | The same dates / daily |
| Requested entry | Buy once at January 2 close | Buy once at January 2 close |
| Returned entry evidence | January 2 close $584.64 in the report | Saved rule used flat SPY position and MinutesAfterOpen > 0 |
| Returned interval | Daily closes in both Python reports | Minute in the final agent answer |
| Inspect the result | 53-point reports and exact sizing recovered | UI reported COMPLETE; final portfolio value was absent from the agent read |
| Change one rule | 50% sizing variant executed and independently checked | No second test submitted in this case |
No matching rows. Clear the filter to see all records.
Observed October 13, 2026. This compares request fidelity and returned artifacts in one task. The NexusTrade native backtest configurations were not independently read, and the account tiers differ. It establishes no matched return, native-engine speed or general product ranking.
Aurora completed its workflow, but it added an intraday condition and disclosed the changed interval and entry timing afterward. Its visible trace showed 99.17 seconds across the whole agent operation and 100% step success. Successful tool steps did not establish that the requested daily close-entry contract was satisfied.
Opening the saved portfolio then showed a different October date window. That separate operation's identity was not verified, so it is excluded from the result comparison. Inspect the accepted run's inputs and returned fields before treating a successful status as an answer to the original request.
The live repair returned the ending value and its evidence limits
Show the table · 10 rows, 3 columns
Scroll sideways to compare all columns. Select a heading to sort.
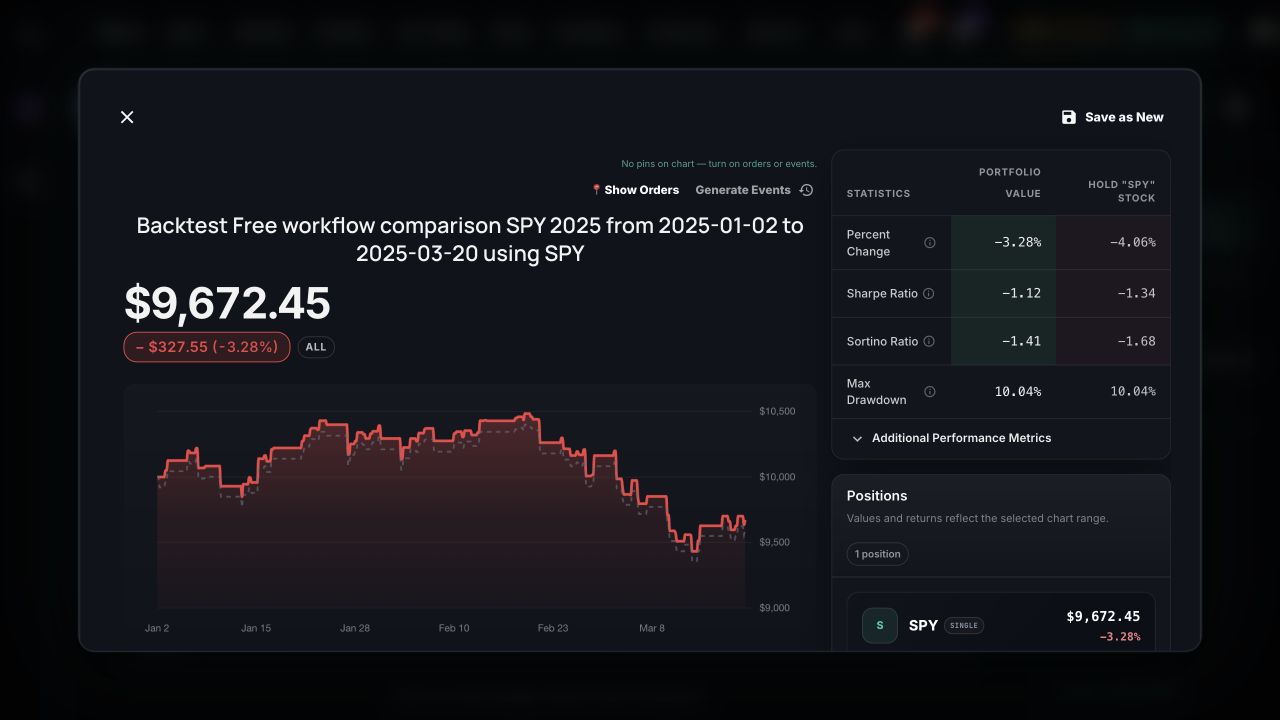
| Requested and accepted configuration | $10,000; Day; January 2 to March 20, 2025; zero configured stock commissions; Market buy | The saved rule and native configuration were independently read. Actual slippage remains unverified because the detailed order tape is unavailable. |
| Ending portfolio value | $9,672.45 at March 20, 2025, 20:00 UTC (16:00 EDT) | The final answer and opened native result agree with the recorded history. |
| Return / maximum drawdown | -3.2755% / 10.0354% | Both metrics reconcile to the retained native result. |
| Recorded history | 109 observations | All 109 portfolio-value points reconcile to the held SPY marks. Cash is a derived residual rather than an independently retained historical cash ledger. |
| First held-position observation | January 2, 2025, 21:00 UTC (16:00 EST) | This is a position observation; the detailed order timestamp was unavailable. |
| Held SPY quantity / average cost | 17.10454253804936 shares / $584.6400146484375 | These are retained position fields; they do not establish a separately recorded order fill price. |
| Aggregate openings / closings / fees | 1 / 0 / $0 | The result retained an open position through the requested final close. |
| Detailed order evidence | Event logging disabled | The final answer disclosed unavailable order fill timestamps, fill prices and the full order lifecycle. |
| Observed whole Aurora task | 141.83 seconds | One fresh normal task, including work beyond the native historical replay. |
| Observed native worker | 0.624651656 seconds | The worker clock excludes model calls and queue time; competitor engine speed remains unranked. |
No matching rows. Clear the filter to see all records.
Fresh production acceptance on October 13, 2026. Fourteen available native checks passed. Detailed event logging remained disabled, so the complete original order-evidence request remains uncertified.
Inspect the request
Read the explanation
A fresh Aurora run on October 13, 2026 returned $9,672.45 for the requested $10,000 SPY experiment from January 2 through March 20, 2025. It created one inactive draft and one new completed backtest. The accepted configuration retained daily historical data, and the first held-position observation was at the requested January 2 regular-market close. The final answer delivered the ending value, return, drawdown and recorded costs.
The financial readback now carries the recorded portfolio value into the answer. Opening the saved strategy showed its current inactive editor; clicking the accepted backtest’s native chart opened the completed result shown here. Detailed event logging was disabled, and the answer explicitly said that the exact order fill timestamp, order fill price and full order lifecycle were unavailable. The held position’s openedAt and average cost are separate position facts. The available financial checks pass; the complete order-evidence request remains uncertified.
Read the benchmark’s entry clock before interpreting the displayed return gap. The native SPY benchmark starts at the January 2 market open, while this strategy’s first held-position observation is at the close. That gap combines different entry exposure with the strategy result. Rebase both curves to the same entry observation before calling a difference alpha.
The measured whole Aurora task took 141.83 seconds and its new native worker reported 0.624651656 seconds. Those clocks cover different work. They provide one observed workflow measurement, while equivalent competitor engine runs and a controlled speed ranking remain outstanding.
Apple's filing shows falling total sales and growing Services
Show the table · 2 rows, 4 columns
Scroll sideways to compare all columns. Select a heading to sort.
| Total net sales | 90,753 | 94,836 | -4.31% |
| Services sales | 23,867 | 20,907 | +14.16% |
No matching rows. Clear the filter to see all records.
Actual Apple Q2 2024 Form 10-Q, statements and revenue note. These are three-month revenue amounts in millions, not current market values, annual totals or strategy returns.
The Apple filing supports both observations: total net sales changed by (90,753 / 94,836 - 1) × 100 = -4.31%, while Services changed by (23,867 / 20,907 - 1) × 100 = +14.16%. A broad revenue summary can hide that difference.
Apple's May 2 earnings release rounds total revenue to $90.8 billion and the decline to 4%. Keep the exact filing units when recalculating the result, and retain the period and source behind the narrative.
Aime's documented task is company research, screening and portfolio analysis
The current AInvest iPhone listing describes Aime stock analysis, news summaries, valuation commentary, filings, technical/fundamental screeners and portfolio tracking with brokerage connections. Those features fit the task of investigating a company and building a candidate list.
The inspected AIME terms dated May 15, 2026 also describe trading simulations and hypothetical strategies. The executed SPY case above provides direct evidence of that workflow; the app description alone would not establish its numerical quality.
NexusTrade's example continues from a written hypothesis to saved conditions, actions, a dated historical request, a benchmark curve and orders to inspect. Evaluate each product by the artifact returned for your task, including the source behind a research answer and the inputs behind a simulation.
The reporting period and the public filing clock are different
Show the table · 5 rows, 3 columns
Scroll sideways to compare all columns. Select a heading to sort.
| Period of report | March 30, 2024 | Identifies the quarter measured. |
| SEC accession | 0000320193-24-000069 | Identifies the exact filing, not just an Apple page. |
| SEC accepted field | May 2, 2024 at 18:04:25, as displayed | Retain the source clock and establish timezone before an intraday join. |
| SEC filing date | May 3, 2024 | The published date field differs from the acceptance field. |
| Apple earnings release | May 2, 2024 | A separate primary publication can make some results public before the filing date. |
No matching rows. Clear the filter to see all records.
SEC filing-detail page and Apple earnings release. This table preserves the displayed accepted clock; it does not silently assign a timezone to an unlabeled field.
The SEC filing index keeps the quarter end, accepted clock and filing date separately. Putting these financial results into a March 30 historical decision would use information published later. Using May 3 for every fact would also ignore Apple's separate May 2 release.
For a dated signal, specify which source supplies the fact, its exact availability policy and any amended version. A historical test needs that information even when today's company analysis is correct.
Ask for a research answer you can reproduce
Use the request below in a research assistant. It is a proposed task grounded in the primary documents above, not a transcript of an Aime response. Check that its answer returns the same periods, units and arithmetic before relying on the interpretation.
Show the table · 5 rows, 2 columns
| Check on the returned answer | Expected from the source packet |
|---|---|
| Period | Three months, with each quarter end named. |
| Units | USD millions; $90,753 million = $90.753 billion. |
| Arithmetic | Total -4.31%; Services +14.16%, using the exact filing amounts. |
| Provenance | A usable filing or release link, not an unsupported summary. |
| Interpretation | Separate the growth observation from a valuation or expected-return claim. |
No matching rows. Clear the filter to see all records.
Explain Apple's three-month revenue change for the quarter ended March 30, 2024. Use SEC accession 0000320193-24-000069 and Apple's May 2, 2024 earnings release. Compare total net sales and Services with the quarter ended April 1, 2023. Show each source value in USD millions, calculate both percentage changes, and separate quarter end, publication and filing dates. Cite the exact documents and identify anything the documents do not establish.Make the investment hypothesis explicit before testing it
Services growth can motivate a company-research question, but the two revenue rows do not define an order. A trading rule also needs an entry threshold, exit, position sizing, evaluation cadence and the source availability used at each decision.
The five-dividend-growers example shows that next stage concretely: a dated S&P 500 universe, ten completed yearly increases in LastDividend, selection of five highest market caps and equal weights. Its saved rule and recorded curve are separate from today's company narrative. Its original historical input vintages still require the audit described in the methodology resource.
For execution evidence, the Claude Code examples include a completed SPY options run with the exact premium budget, selected contract, decision and fill. Claude Code read that result after native tools created it. The retained pricing warning and open position remain part of the interpretation.
Show the table · 5 rows, 2 columns
| Research stage | Artifact to keep |
|---|---|
| Company analysis | Source documents, reporting periods, units, arithmetic and cited interpretation. |
| Candidate screen | Exact filters, as-of clock, returned rows and missing-data policy. |
| Historical strategy | Saved entry/exit/allocation rules, input availability, dates, costs and benchmark. |
| Result inspection | Full retained curve scope, holdings, decision records, fills and warnings. |
| Paper observation | Its own forward timestamps and simulated portfolio identity, kept separately from the backtest. |
No matching rows. Clear the filter to see all records.
Keep native controls and request fidelity in the same comparison
NexusTrade also has native visual rule authoring, strategy discovery and paper portfolio tracking. Its condition tree exposes the saved rule, and marketplace controls support filtering, comparison and copying a strategy to paper. Those capabilities do not erase the request mismatch in the observed Aurora case. A completed task must still preserve the requested entry, interval and returned result.
Choose by the next piece of evidence you need
AInvest completed the bounded daily-stock simulation and sizing iteration shown above. Its documented analysis, screeners, filings and portfolio tracking also fit company research. Inspect the retained report rather than accepting a generated conclusion without the inputs.
NexusTrade provides saved strategy rules, native historical results and retained decision/fill evidence in its worked examples. The Aurora case on this page also shows why interval, entry timing and returned fields need checking. Select the workflow that satisfies your exact task and retain its complete result.
Inspect the completed NexusTrade examples or use the Apple request above to evaluate the source quality of your next research answer.
No comments yet.