TL;DR
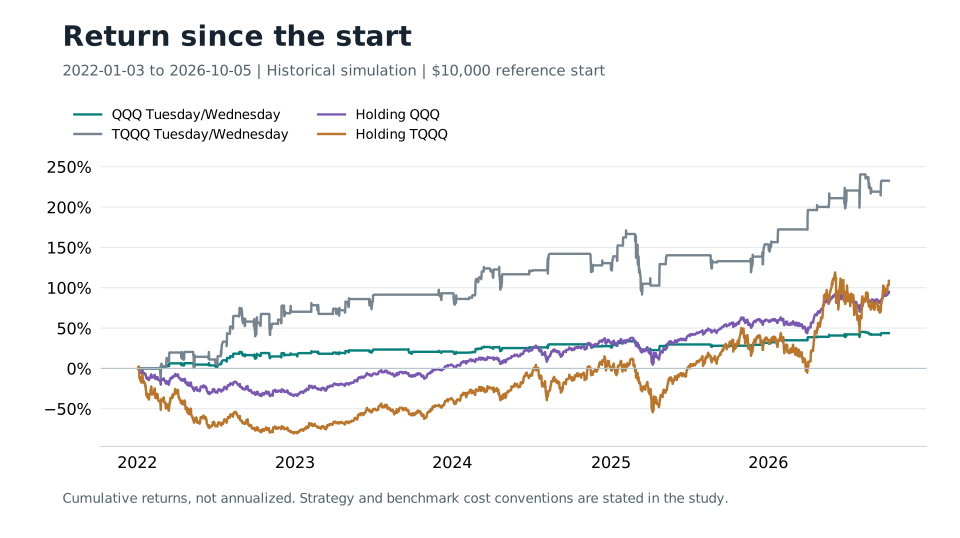
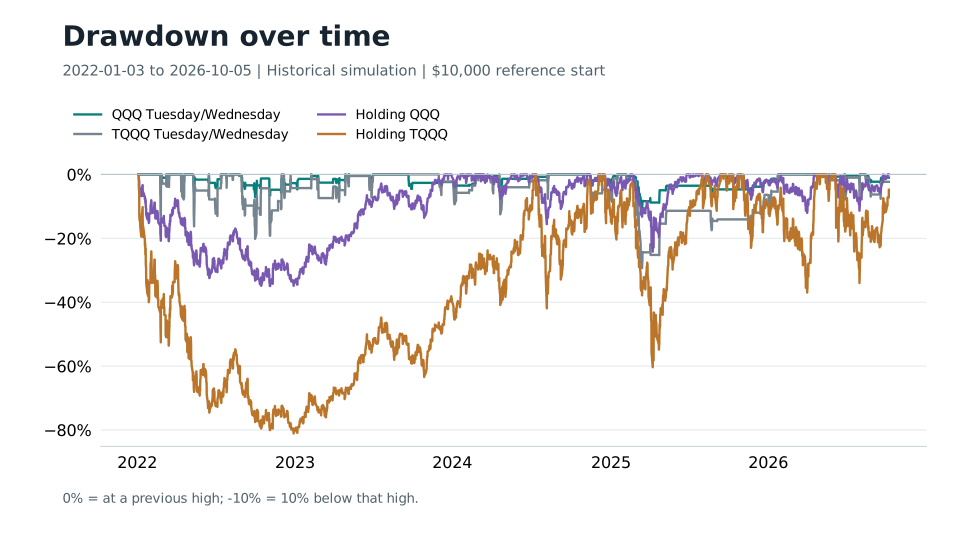
Tuesday and Wednesday entries improved the QQQ strategy's January 2022 to October 5, 2026 return to 43.77%, with 10.44% drawdown, while holding QQQ returned 94.97%. The TQQQ version gained 232.64% broadly, but its fresh 2025-start return was 39.21% with 29.32% drawdown. Holding unleveraged QQQ then grew more and fell less. The recent shortfall stopped this pilot; a diagnostic earlier exit was not a complete repaired-portfolio test.
- QQQ adaptation, 2022 start
- 43.77% return
- TQQQ adaptation, 2022 start
- 232.64% return
- TQQQ recent worst decline
- 29.32%
- Recent holding QQQ return
- 48.27%
The broad lead and its leverage
- QQQ Tuesday/Wednesday 2026-10-05, 16:00:00 EDT
- 43.77
- TQQQ Tuesday/Wednesday 2026-10-05, 16:00:00 EDT
- 232.64
- Holding QQQ 2026-10-05, 16:00:00 EDT
- 94.97
- Holding TQQQ 2026-10-05, 16:00:00 EDT
- 108.5
Cumulative return (%)
Use the line buttons to compare the strategy with its recorded controls. Then switch to drawdown to inspect the losses behind the return.
- First recorded mark
- Jan 3, 2022 · 09:30:00 NY
- Last recorded mark
- Oct 5, 2026 · 16:00:00 NY
- Vertical axis range (percent)
- -80.63 to 240.47
At the recorded endpoint: QQQ Tuesday/Wednesday 43.77%; TQQQ Tuesday/Wednesday 232.64%; Holding QQQ 94.97%; Holding TQQQ 108.50%. These are cumulative returns over this window, not annual rates.
- QQQ Tuesday/Wednesday 2026-10-05, 16:00:00 EDT
- -0.99
- TQQQ Tuesday/Wednesday 2026-10-05, 16:00:00 EDT
- -2.3
- Holding QQQ 2026-10-05, 16:00:00 EDT
- 0
- Holding TQQQ 2026-10-05, 16:00:00 EDT
- -4.8
Below the prior peak (%)
Choose the lines whose losses you want to compare. Hiding a line changes this view only; the recorded dates and chart scale stay fixed.
- First recorded mark
- Jan 3, 2022 · 09:30:00 NY
- Last recorded mark
- Oct 5, 2026 · 16:00:00 NY
- Vertical axis range (percent)
- -81.09 to 0.00
Zero is a prior high; -10 means 10% below that book’s prior peak. Compare losses over the same recorded window; these marks do not measure every intraday extreme.
Wednesday helped the original model, but recent returns disappointed
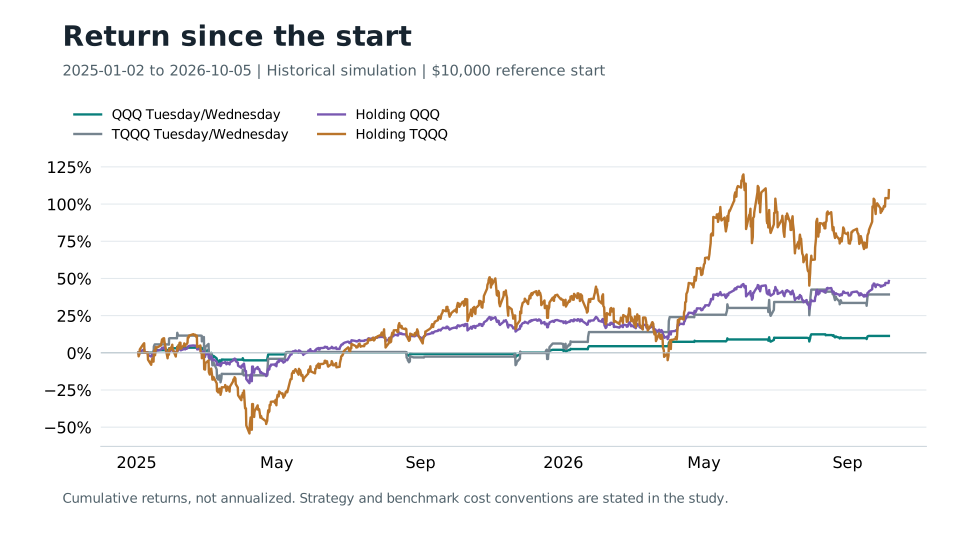
Adding the article's Wednesday entries improved the QQQ test from 21.71% to 43.77%, after modeled fees, over January 3, 2022 to October 5, 2026. Holding QQQ returned 94.97%. The strategy's drawdown was only 10.44%, but a fresh January 2025 test returned 11.32% against QQQ's 48.27%. That was too much recent growth sacrificed for this outreach pilot.
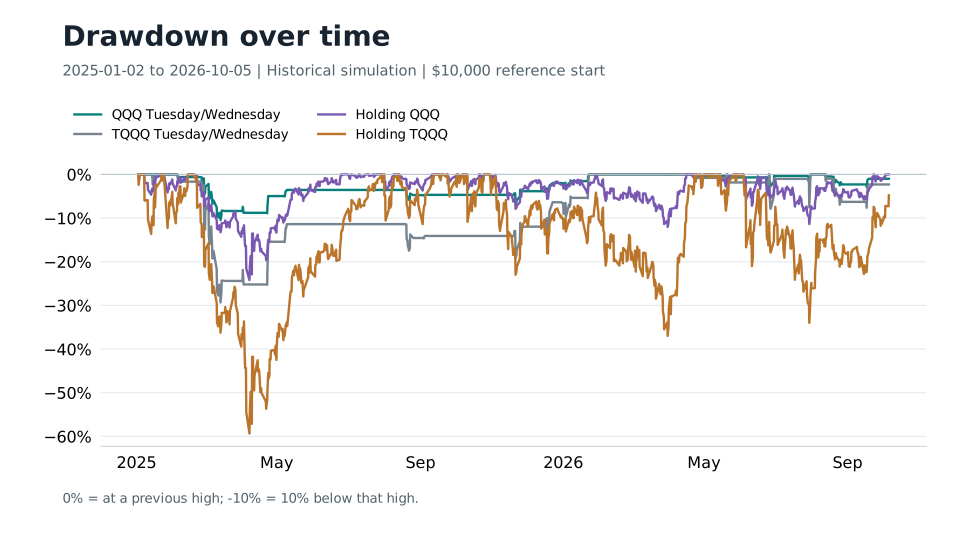
The TQQQ implementation returned 232.64% in the broad test against 108.50% for holding TQQQ. Its recent return fell to 39.21%, with a 29.32% drawdown. Unleveraged QQQ returned more over those recent dates, 48.27%, with a smaller 24.17% drawdown. The striking broad number did not resolve that weakness.
The source is the May 26, 2024 article Turnaround Tuesdays on Steroids, published under the author name Quantitativo. This report uses that public byline; no personal identity is inferred. Both created portfolios are independent implementations, with a next-opening exit adaptation and finite historical signal data.
Inspecting the losing trade
The worst closed TQQQ episode entered February 25, 2025 at $40.165 and exited March 17 at $30.94. Its net trading loss was 23.12%, excluding dividends. The corresponding QQQ episode lost 7.82%. Leverage magnified a source-style entry that did not rebound promptly.
A diagnostic held the original TQQQ entry fixed and inspected earlier exits. A completed-close 5% loss trigger would have filled February 28 near $35.73, a net episode loss of 11.22%. That is an episode comparison, not a revised portfolio backtest: reentries, subsequent signals and compounding were not modeled in that calculation. The same diagnostic touched five originally winning episodes, so a stop cannot be assumed to improve the whole strategy.
Long cash intervals also missed recoveries. Between the May 9 and August 19, 2025 openings, TQQQ rose 55.13% while the original book was flat. Two 2026 flat intervals coincided with 38.24% and 21.09% asset-price rises. A tighter loss exit does not by itself fix the entry drought.
Published rules and the exit adaptation
Show the table · 6 rows, 2 columns
| Part | Rule |
|---|---|
| Tuesday control | Buy at Tuesday's opening after the prior two completed exchange-session closes declined consecutively. |
| Published extension | Allow the same entry on Tuesday or Wednesday. |
| Source exit | Exit when the completed close exceeds the previous session's high. |
| Our exit | Fill at the following regular opening after that completed-close signal. This differs from the source's triggering-close fill. |
| Leveraged instrument | Actual TQQQ prices and its own signals, not QQQ returns multiplied by three or synthetic pre-inception prices. |
| Capital and costs | $10,000; fractional shares; full available cash subject to execution reserve; 0.1% per fill; cash dividends; no idle interest, extra slippage or taxes. |
No matching rows. Clear the filter to see all records.
Source-published Wednesday inclusion was tested directly. No additional weekday search or tuned filter is presented as an improvement.
Matched broad and recent results
Show the table · 2 rows, 5 columns
Scroll sideways to compare all columns. Select a heading to sort.
| Jan 3, 2022 to Oct 5, 2026 | 43.77% / 10.44% | 94.97% / 34.92% | 232.64% / 29.32% | 108.50% / 81.09% |
| Jan 2, 2025 to Oct 5, 2026 | 11.32% / 10.44% | 48.27% / 24.17% | 39.21% / 29.32% | 109.37% / 59.32% |
No matching rows. Clear the filter to see all records.
Cumulative return / maximum observed drawdown. Native holding benchmarks reinvest dividends immediately without trading fees, unlike the strategy's cash-dividend convention.
The recent comparison that stopped the pilot
- QQQ Tuesday/Wednesday 2026-10-05, 16:00:00 EDT
- 11.32
- TQQQ Tuesday/Wednesday 2026-10-05, 16:00:00 EDT
- 39.21
- Holding QQQ 2026-10-05, 16:00:00 EDT
- 48.27
- Holding TQQQ 2026-10-05, 16:00:00 EDT
- 109.37
Cumulative return (%)
Use the line buttons to compare the strategy with its recorded controls. Then switch to drawdown to inspect the losses behind the return.
- First recorded mark
- Jan 2, 2025 · 09:30:00 NY
- Last recorded mark
- Oct 5, 2026 · 16:00:00 NY
- Vertical axis range (percent)
- -54.23 to 119.93
At the recorded endpoint: QQQ Tuesday/Wednesday 11.32%; TQQQ Tuesday/Wednesday 39.21%; Holding QQQ 48.27%; Holding TQQQ 109.37%. These are cumulative returns over this window, not annual rates.
- QQQ Tuesday/Wednesday 2026-10-05, 16:00:00 EDT
- -0.99
- TQQQ Tuesday/Wednesday 2026-10-05, 16:00:00 EDT
- -2.3
- Holding QQQ 2026-10-05, 16:00:00 EDT
- 0
- Holding TQQQ 2026-10-05, 16:00:00 EDT
- -4.8
Below the prior peak (%)
Choose the lines whose losses you want to compare. Hiding a line changes this view only; the recorded dates and chart scale stay fixed.
- First recorded mark
- Jan 2, 2025 · 09:30:00 NY
- Last recorded mark
- Oct 5, 2026 · 16:00:00 NY
- Vertical axis range (percent)
- -59.32 to 0.00
Zero is a prior high; -10 means 10% below that book’s prior peak. Compare losses over the same recorded window; these marks do not measure every intraday extreme.
What was verified and what comes next
The QQQ broad sequence contained 128 filled orders and $1,576.83 in modeled fees. Its audit matched the complete expected signal sequence, canonical 9:30 Eastern opening prices and full exit quantities. The TQQQ broad book paid $2,587.22 in modeled fees. Public curves retain every archived mark and the separate native holding controls.
These are inspected historical development tests. The retained private portfolios are inactive and their signals have no verified continuing refresh.
Detailed measurement and provenance notes
Read the full accounting, source and execution assumptions
The original private research portfolios stay inactive, and their downloaded historical signals have no verified continuing refresh. These inspected historical tests are development evidence. A future change needs its own complete broad and recent replay before any claim of a repaired strategy or an ongoing paper pilot.
No comments yet.