

Where this goes next
What a corpus this size is actually for
A ranking is a survey. Nobody was randomly assigned an indicator. The archive contains selected tickers and rules, but does not establish whether a person, an agent or another process authored each one. The ordering above tells you where to look, not what causes what.
222,010 outcomes is enough to stop guessing and start testing. Three things become possible here that a smaller dataset cannot support.
1. Run the experiment instead of the survey
Take one strategy, one universe, one window, one rebalance cadence, and change exactly one thing. The indicator goes in, or it comes out. Everything else is held. Run both.
That is a controlled experiment, and it is a backtest sweep the platform already knows how to run. The ranking's job is telling you where to point it. You cannot sweep everything, and 31 candidates ordered by median Sharpe is a very good prior.
2. Go down to the configuration, not the type
An indicator type is not one rule, and treating it as one rule is the weakness of every ranking including this one. A 200-day moving average used as a trend filter and a 3-day moving average used as a trigger share a name and nothing else. They belong at opposite ends of this table, and right now they sit in the same row.
I said in the last piece that I could not answer this, because the lookback column was empty across all 304,426 SimpleMovingAverage rows. The column was empty, and the reason was a bug of mine. The corpus exporter looked for a top-level lookback field. The window is stored at window.length, so the extractor found nothing and wrote a null for all 4,424,078 indicator rows. Nothing failed loudly, because the export succeeded and the column existed. It was simply always empty, and the value was sitting in the same table the whole time, one column over in the raw parameters.
Read correctly, and with cloned experiments collapsed, it answers the question, and the answer is yes.
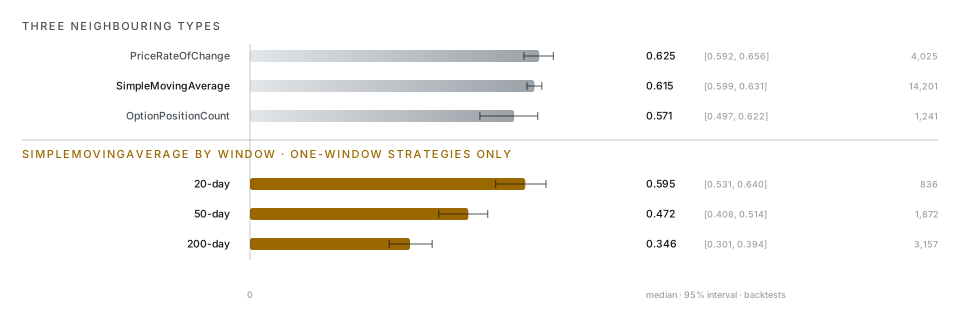
This took two corrections to get right, and the first published version of each was wrong. Bucketing every backtest by every window it contained counted crossover strategies twice and produced a 0.261 spread. Fixing that but leaving cloned experiments in place flattened the whole thing to 0.038, with every difference straddling zero, and I published that as a null result. Collapsing clones as well, a 20-day average beats a 200-day one by 0.244 with an interval of [+0.175, +0.310], and all three pairs separate.
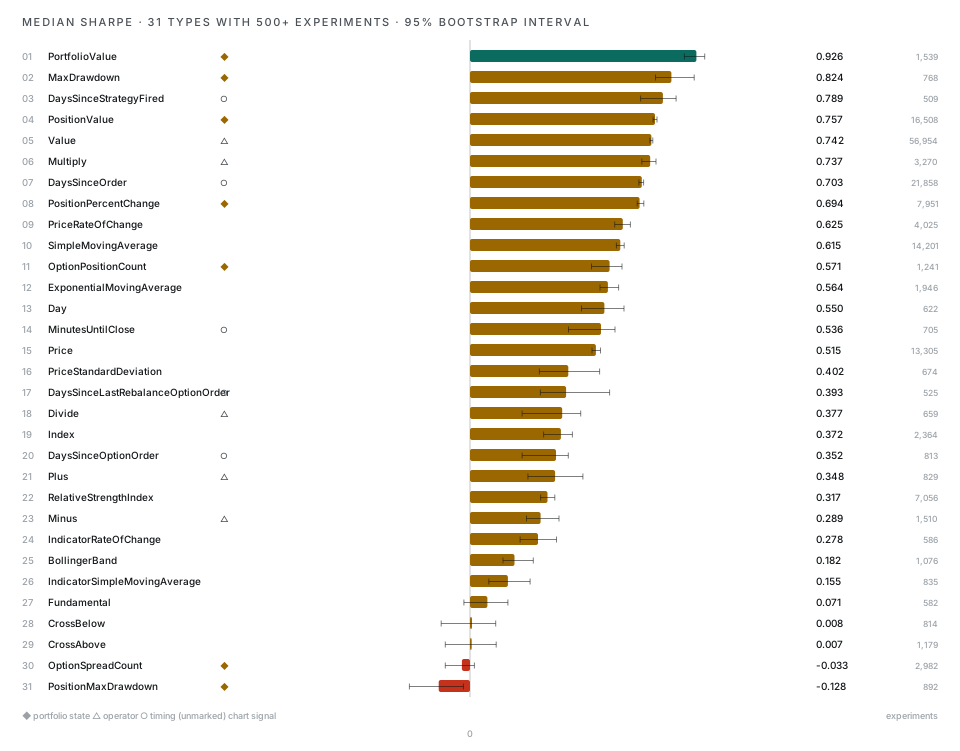
So the setting matters more than the type. SimpleMovingAverage sits tenth at 0.615, just below PriceRateOfChange at 0.625, and its neighbours sit within about 0.06 of it. The windows inside SimpleMovingAverage span 0.249, four times that gap, and unlike the neighbours they separate cleanly. Ranking types puts the answer at the wrong level, and the shorter the average the better it did.
3. Train on the outcomes
A strategy paired with what it did is a labelled example. 222,010 of them is a training set, and a rare one: the input is structured rather than prose, the label is a number rather than a judgement, and nobody wrote any of it to be training data.
That is the shape you need to fine-tune a model to write strategies that land in the top decile instead of the middle of the distribution. Every language model can already describe what a good strategy looks like. This would be one that has seen 222,010 attempts and what each of them returned. The obvious hazard is that a model trained to maximise backtest Sharpe learns to overfit backtests, so the label has to be out-of-sample performance rather than the number the corpus already holds.
Corrections
What twice the data revised
The corpus doubled, so I checked what it broke. Three conclusions from my 2025 analysis of 114,549 backtests did not survive the larger sample.
Contradicted
"More rules, worse results"
The 2025 piece showed complexity dragging Sharpe down and I published a scatter plot to prove it. The larger corpus shows a U shape instead: 1 rule 0.932, 2 rules 0.606, 3 to 4 rules 0.791, 5 to 8 rules 0.927, 9 or more 0.845. The worst place to be is two rules, not nine. The simple version of that finding was wrong.
Contradicted
"The 200-day SMA is the single most powerful indicator"
I was ready to file this one as untestable, because the lookback column was empty across all 304,426 SimpleMovingAverage rows. It was empty because of a bug of mine, described above, and the window was recoverable from the same table all along. Read correctly, it is contradicted. Among deduplicated experiments using a single window, the 200-day average medians 0.346 against 0.595 for a 20-day one, and the intervals do not overlap. The 200-day average is not the most powerful setting of a moving average. It is the weakest of the three that clear the floor, and it is the most popular.
Corrected after publishing
The ranking counted the same experiment thousands of times
A reader asked why PositionValue and PositionPercentChange both showed a confidence interval of exactly [0.927, 0.927]. An interval with no width means a large pile of backtests sharing one value, and there was: 1,075 separate portfolios with byte-identical returns on AAPL over the same window, running fifteen variations of one strategy. Sixty-six Sharpe values were each shared by a hundred or more backtests, covering 32% of the runs behind the first version of this ranking.
That is cloning and forking working as designed, not a calculation error. The error was mine, in treating each copy as an independent observation. It is the same argument as the reliability floor, one level up: a type used in nine backtests has little coverage, and a thousand copies of one strategy do not supply a thousand independent strategy observations. Counting distinct experiments instead keeps 47.8% of the runs.
Every number above is the corrected version. What moved: PortfolioValue fell from 1.244 to 0.926, PositionPercentChange left the top four for seventh, the floor now clears 31 types rather than 34, and MinutesAfterOpen dropped out entirely. RSI moved from 23rd of 34 to 22nd of 31. The shape of the finding did not change, and the moving-average result reversed twice before it settled, which is in the section above.
Withdrawn
"Momentum for growth stocks, mean reversion for indexes"
This one depends almost entirely on how you classify a strategy. The price-versus-moving-average rule dominates the classifier and the trend-filter cutoff is arbitrary, so the finding moves when the definition moves. It needs a sensitivity sweep before anyone repeats it, including me.
A second result
The sell rule
While the ranking was running I split every backtest containing a buy action on whether it also contained a sell action. Strategies that never sold posted a median return of 36.41% against 19.50% for strategies that did. Nearly double, and it holds in both eras rather than being a 2020s bull-market artifact.
Then I restricted the same split to runs carrying a benchmark. Of the strategies that never sold, only 43.3% beat simply holding the asset, with a median alpha of -0.85. Of the strategies that did sell, 57.0% beat it, at +8.77.
What that means
Never selling produces big raw returns and still loses to buying and holding the same asset. The benchmark subset is 4,525 runs and skews recent, so treat it as directional rather than settled.
Methodology
How this was measured
The source is a snapshot of the NexusTrade backtest archive taken on 6 September 2026, covering 400,203 scanned documents. The historical analysis selects backtests lasting 365 to 2,000 days with nonzero recorded return and excludes optimizer-labeled records. The nonzero-return flag is a proxy; it does not verify trade count or human authorship. The type table, configuration comparisons, complexity and buy/sell summaries retain their historical aggregation methods.
Each backtest counts once per indicator type, so a strategy using the same indicator in four conditions contributes one observation rather than four. Rankings are medians, not means, because a handful of leveraged outliers move a mean and tell you nothing about the typical strategy. Every median carries a 95% bootstrap interval from 4,000 resamples, and where two intervals overlap I do not claim an ordering between them. Counting is by distinct EXPERIMENT rather than by backtest: cloned and forked portfolios mean the same strategy on the same tickers over the same window appears many times, and counting each copy treats one experiment as a thousand independent observations. Keying on the strategy logic, the tickers and the window keeps 47.8% of eligible runs. Window comparisons additionally count only strategies using a single window of that type, because a crossover strategy holds two and would otherwise be counted in both.
Only aggregate results for built-in indicator types appear anywhere in this analysis. Creator-owned custom indicators, their names, their parameters, their identifiers and their underlying strategy logic stay private, and the results-only table they live in cannot be joined back to any strategy, portfolio or user.
Ask the corpus yourself
Every table in this piece is a question I typed in English. The archive is queryable by the platform's AI agent, which writes read-only SQL against the backtest tables and hands back the rows, so "median Sharpe by moving-average window, minimum 500 backtests" is a sentence rather than a query. Ask which setting of an indicator you already use has done best, whether your rule reads better driving a buy or a sell, or how a type performs once you hold the timeframe fixed.
Ask carefully, though, because the agent answers the question you asked. Put that moving-average question to it plainly and it will bucket every backtest by every window it contains, count each 50/200 crossover twice, and handed me a spread I nearly published. Adding "only strategies that use a single window" changes the answer and is the difference between a finding and an artefact. The corpus removes the work of gathering the data. It does not remove the work of asking a clean question.
The sweep that turns a correlation into an experiment is queryable the same way. Hold your own strategy fixed, change one rule, and run both, without writing any code.
Ask it about a setting you useEvery number here comes from the NexusTrade backtest archive, which is why each row carries its sample size instead of a screenshot of a chart. If you want the anonymized aggregate results to run the ranking yourself, send me the word CORPUS.
No comments yet.