I tested Mswing, “the one indicator to rule them all”. It didn’t work.
A Cautionary Tale to Doubt What You Read Online
 Austin Starks8 min read
I came across this Medium article about a technical indicator dubbed Mswing. From the 5 minutes it took me to read the article, the only thing I could think was “this sounds too good to be true”.
That’s because it was.
Meet Mswing: The Trading Tool That Does It All
Ever wished for one indicator that could cut through the noise and just tell you what’s up with a stock? Say hello to…
medium.com
To quote the article exactly.
They call it the “one indicator to rule them all,” and honestly, it’s not hype. It’s a momentum tracker, a strength gauge, a signal machine, and even a market mood ring
Wanting to see if this indicator was truly revolutionary, I decided to put it through an objective test.
As you can guess, it didn’t do so well.
The Rationale Behind MSwing
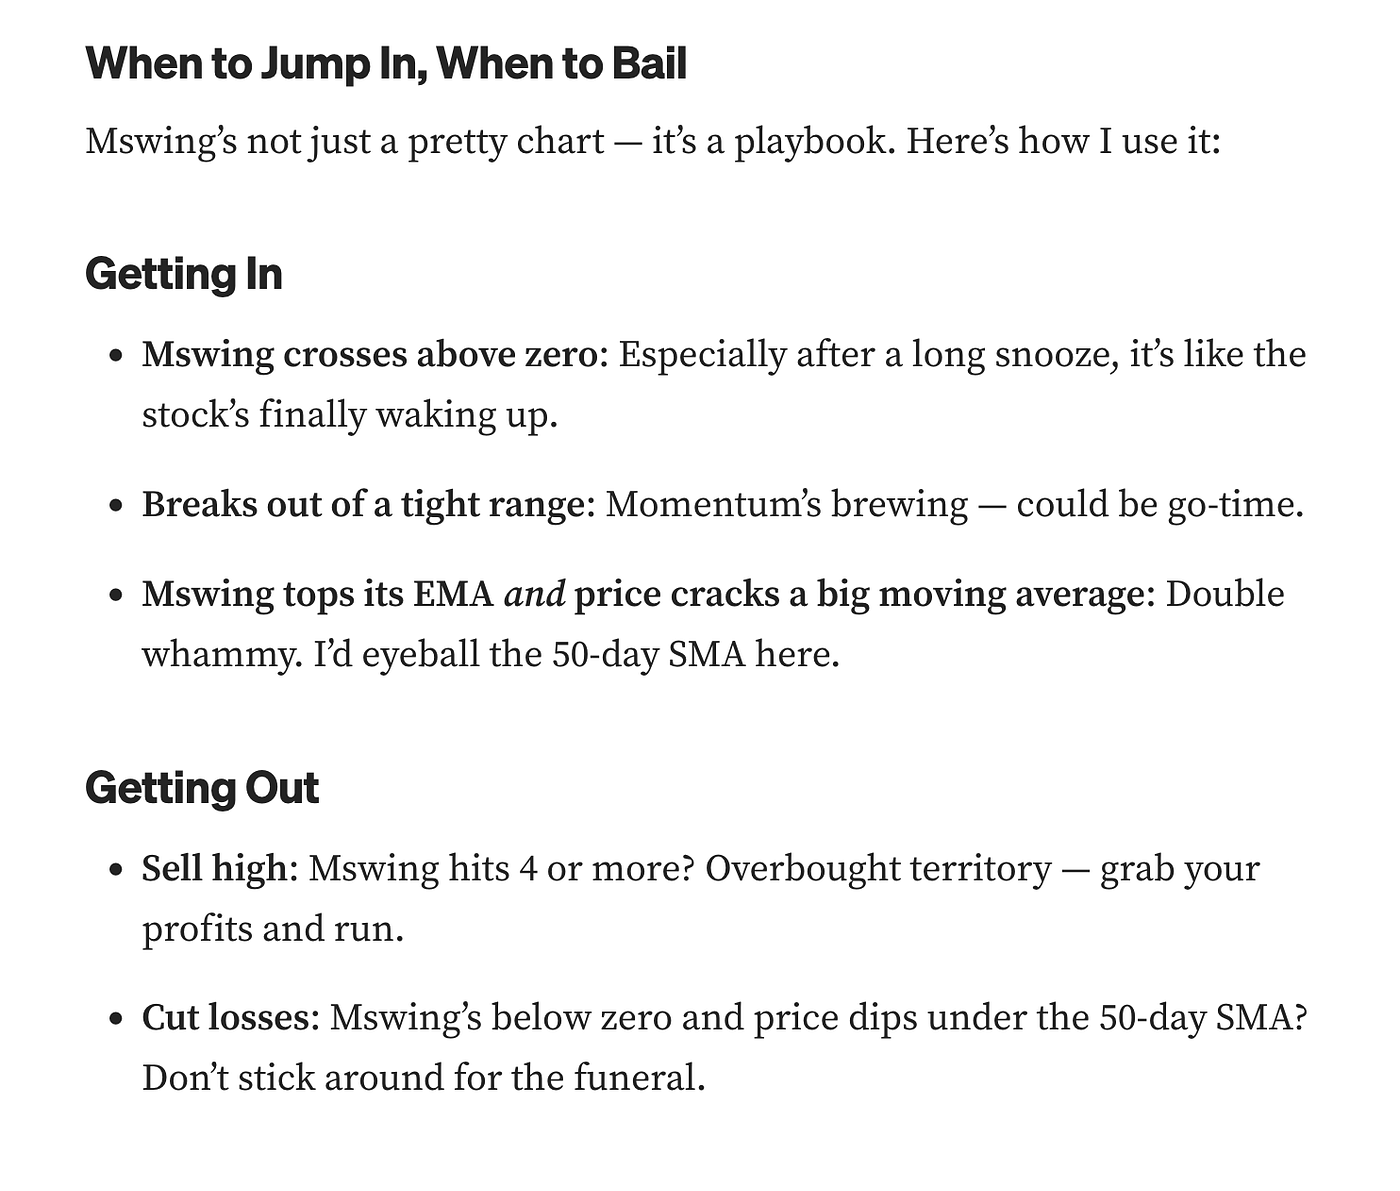
To give credit to the author, this indicator was fairly unique and it was logically sound. It combined a stock’s slow rate of change, fast rate of change, and moving averages to determine if a stock truly has momentum. The exact rules are detailed in the original article.
Having just created a wildly profitable trading strategy using the world’s most simple indicator (a 200 day SMA), I wanted to see if I could do the same thing with “the one indicator to rule them all”.
How I used this well-known technical indicator to beat the market by more than 100%
How to use the Simple Moving Average to Outperform the Market I saw a "TikTok guru" make an outrageous claim. And it…
nexustrade.io
Here’s how I tried it.
Using AI to streamline financial research and analysis
I used an AI backtesting platform to develop and research the Mswing indicator. You can read the full conversation I had with the AI here.
Top 100 Stocks by Market Cap and Momentum Strategy
A conversation about identifying top stocks by market cap in 2018, 2020, 2022 and 2025, and developing a momentum-based…
nexustrade.io
Unlike other platforms like TradingView or Ninjatrader, NexusTrade allows you to create, backtest, and deploy algorithmic trading strategies without writing a single line of code. Instead it uses the programming language that we all understand.
The English language.
To follow along the rest of the article, you should:
Many of the decisions I make in this article (such as fetching a list of the top 100 stocks by market cap at a certain date) might seem arbitrary, but are highly deliberate. For example, I’m creating the strategies in a way to avoid lookahead bias. To have a better picture in your head about why I’m doing certain things, check out the following article.
How I used this well-known technical indicator to beat the market by more than 100%
How to use the Simple Moving Average to Outperform the Market I saw a "TikTok guru" make an outrageous claim. And it…
nexustrade.io
Creating our initial trading strategy
I first navigated to the AI chat to fetch a list of the top 100 stocks by market cap.
what are the top 100 stocks by market cap as of 2018?
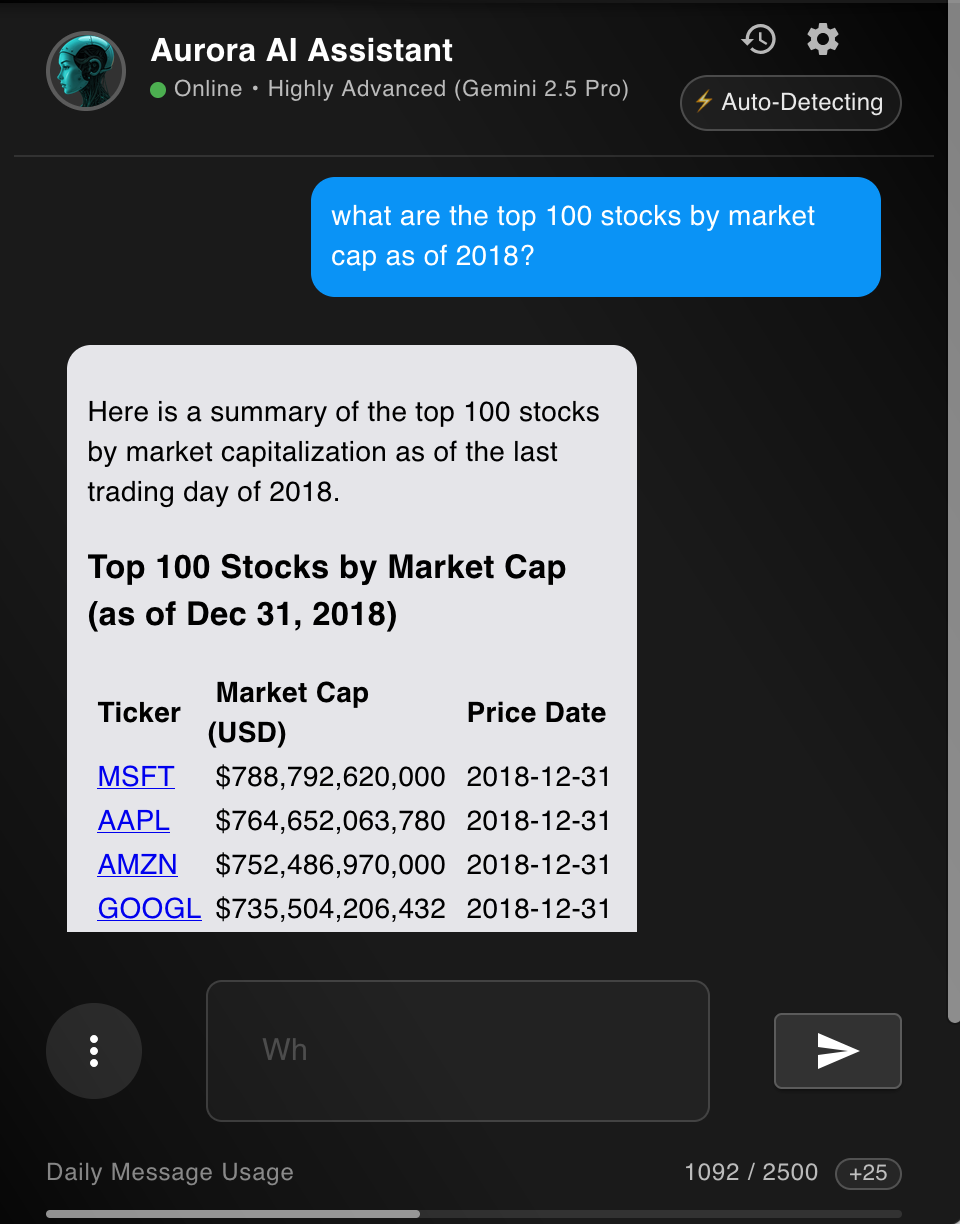
The rationale behind this is that just holding the top stocks by market cap tends to match the performance of the S&P500.
I’m basically cheating for the Mswing strategy in its favor.
Next, I used the AI to transform the Mswing indicator into a strategy. These rules come exactly from the original article. I even copy/pasted the article into Claude and verified that the translation was correct. If I didn’t make a faithful adapation, I’m more than happy to be proven wrong. But specifically, I said:
Note: Mswing is 20 Day Rate of Change + 50 Day Rate of Change
Create the following trading strategy to rebalanace this list of stocks (excluding GOOGL and BRK-A). Filter to stocks that have one of the conditions met:
- We have the positions in the portfolio and mswing of the positions is less than 4 and (mswing is greater than 0 or the price is above its 50 day SMA)
- Mswing is greater than the 9-day EMA of mswing
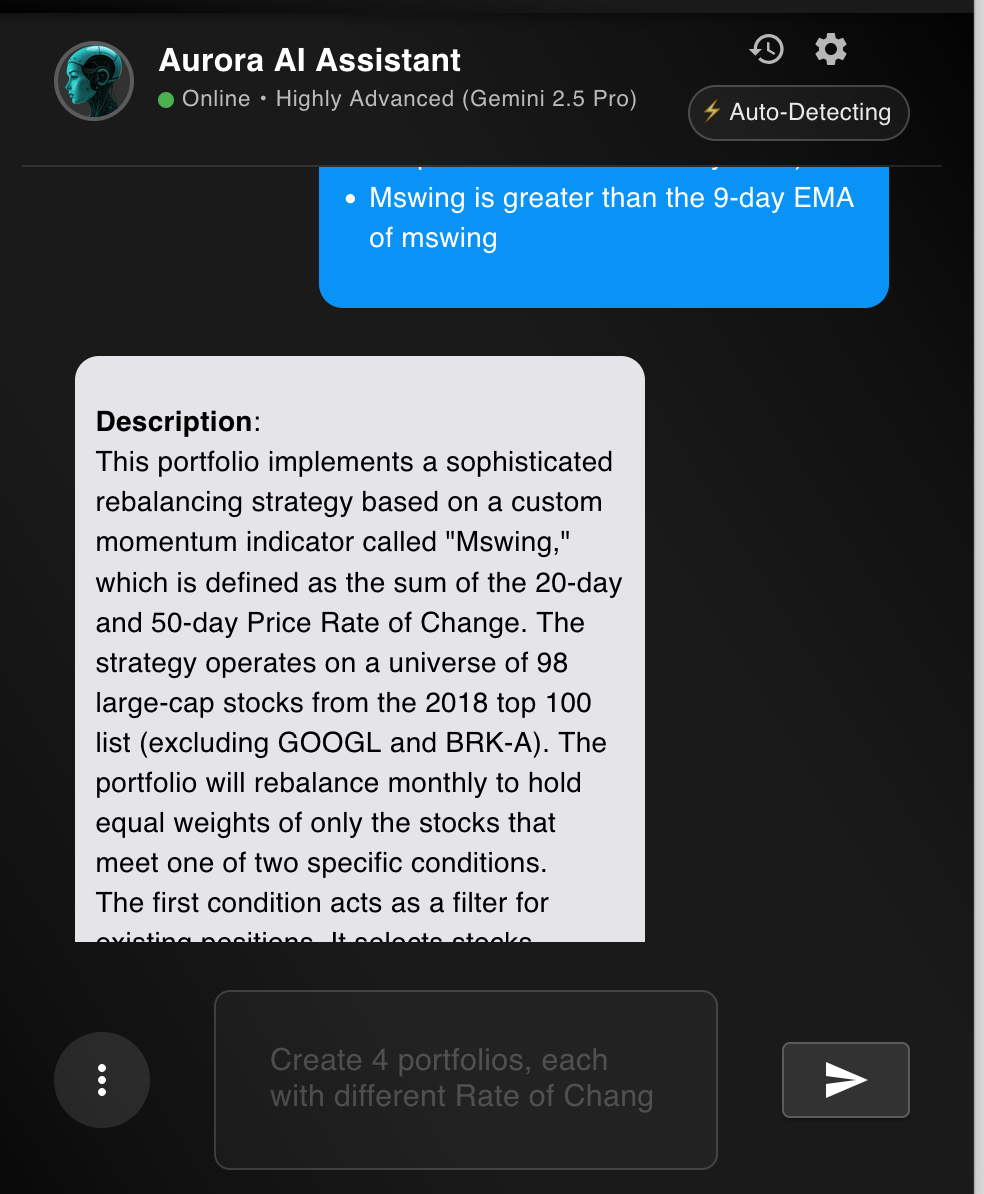
This created a trading strategy that honestly didn’t perform very good at all. In the backtest, it’s down 5% in the past 180 days while the broader market is reaching all time highs.
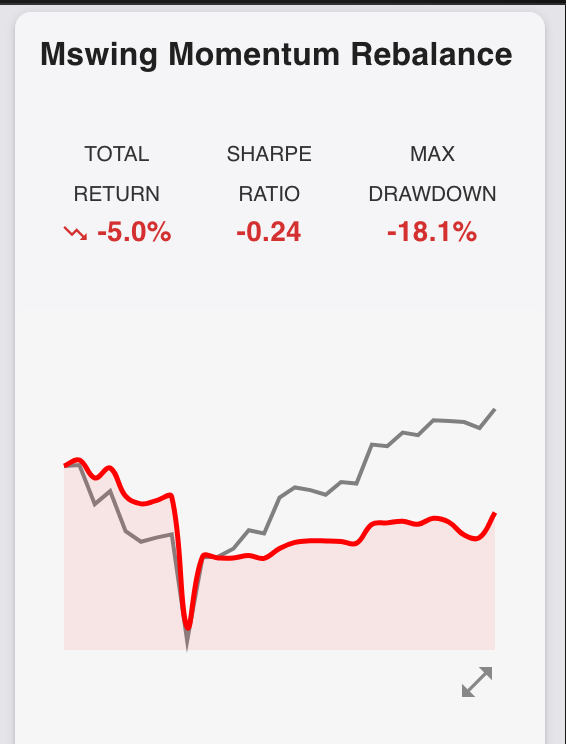
Not a reassuring start.
I decided to add some filters – one by Mswing.
The historical follow-up request was: “let’s limit to 7 stocks.” For a new comparison, specify the ranking rule explicitly and preserve the full entry and exit conditions. This clarification is a prospective instruction; the short quoted request alone does not prove the saved sort order.
and one by market cap.
let’s also try limiting to 7 and sorting by market cap descending
The results were mixed.
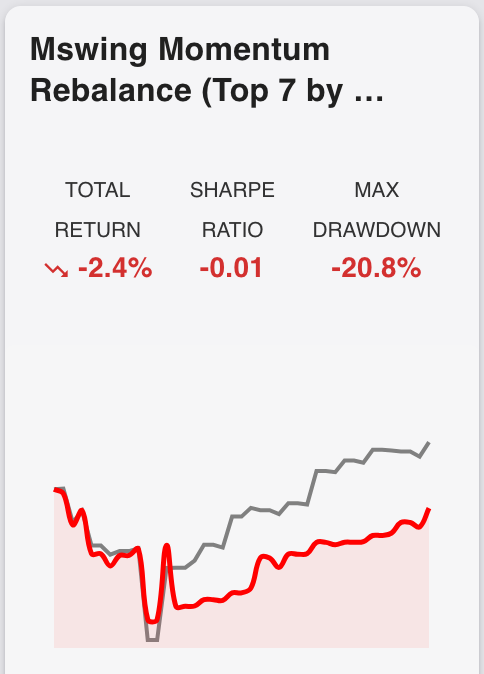
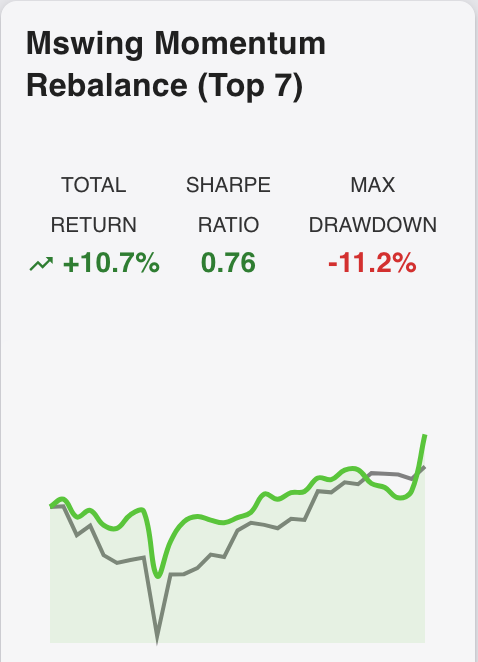
I then decided to run some backtests to get a quick sense of which strategy is better.
backtest these portfolios from
* 01/01/2019 to 01/01/2020
* 01/01/2019 to 01/01/2021
* 01/01/2020 to 01/01/2021
In the initial three overlapping test windows, the original Mswing variant beat SPY twice, the seven-stock Mswing-ranked variant once, and the seven-stock market-cap-ranked variant three times. These comparisons selected a candidate; overlapping windows are not three independent samples.
| Stage | Variants and universe | Test windows |
|---|---|---|
| Exploratory selection | Original, seven-stock Mswing-ranked and seven-stock market-cap-ranked; list requested as of 2018 | 2019-01-01 to 2020-01-01; 2019-01-01 to 2021-01-01; 2020-01-01 to 2021-01-01 |
| Later evaluation | Market-cap-ranked approach; refreshed list requested as of 2020 | 2021-01-01 to 2022-01-01; 2021-01-01 to 2023-01-01; 2022-01-01 to 2023-01-01 |
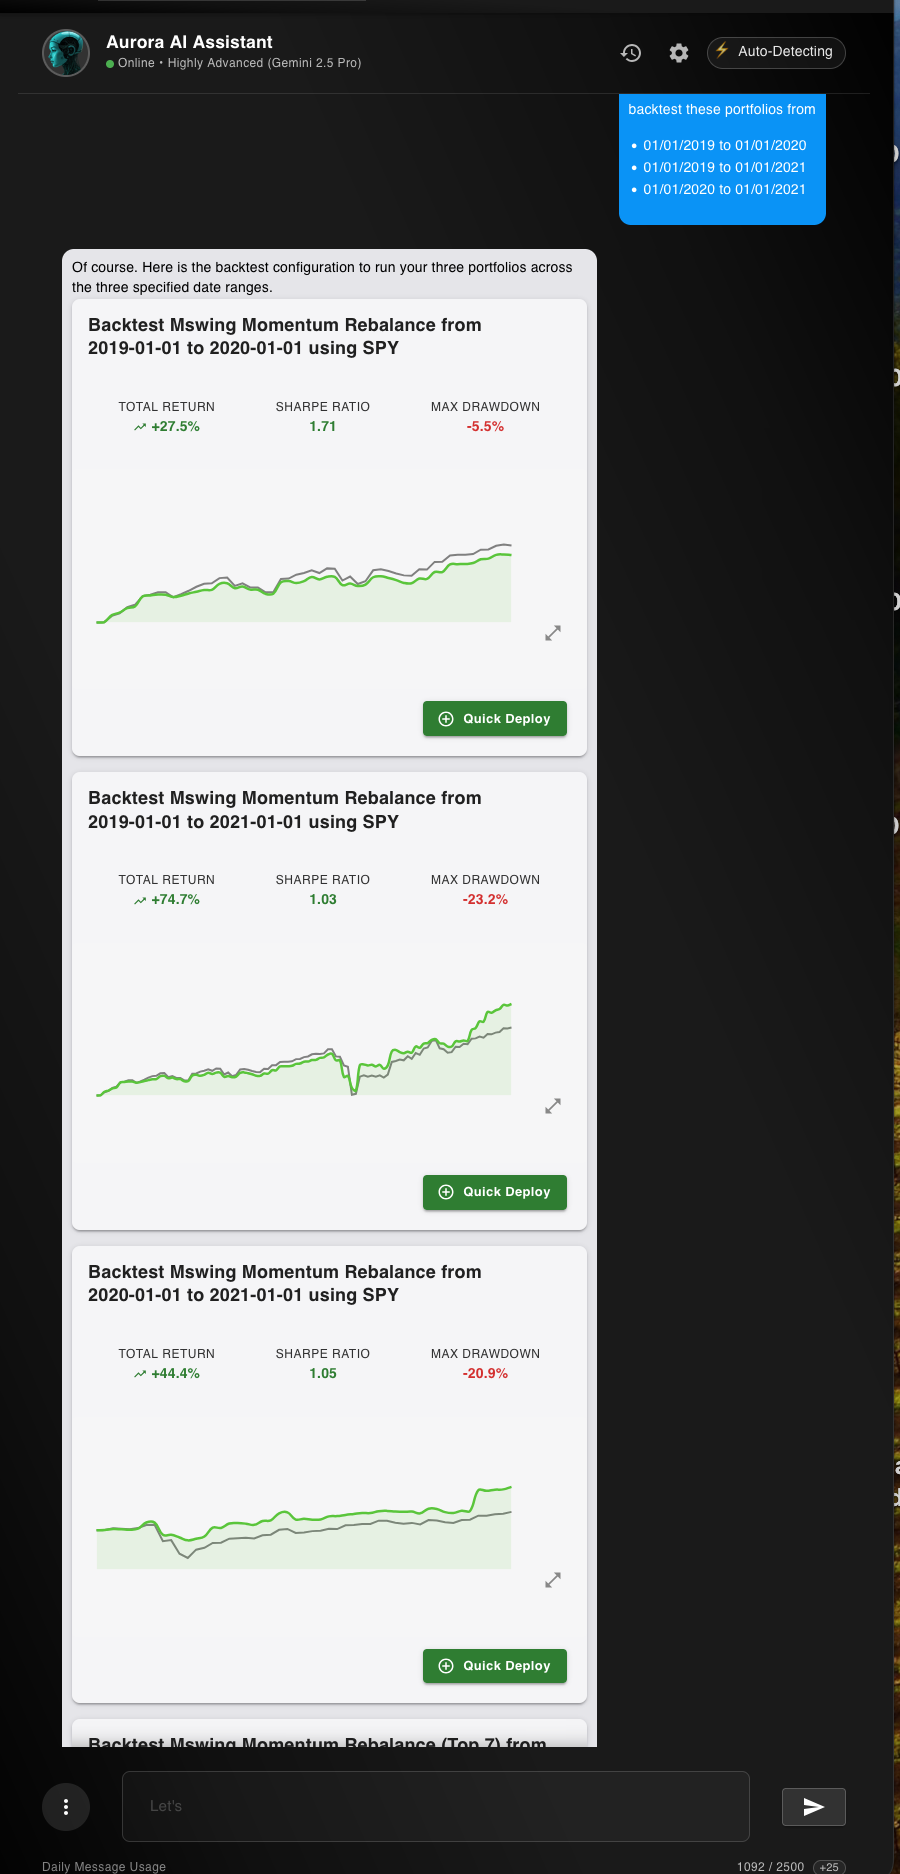
Now, what I could have done from here was data-mined a strategy; I could’ve kept running backtests on different periods, and pick the 1 strategy that does well in all of them
But that’s a horrible idea.
Data mining a strategy is an extremely easy way to overfit. The strategy might have survived in a variety of market conditions, but that’s just because of sheer luck and coincidence.
It won’t translate to the real world.
I selected the seven-stock, market-cap-ranked variant after comparing the initial periods. Those periods were exploratory selection, not independent proof of robustness. I then carried that approach into later evaluation while refreshing the stock universe. For a new experiment, freeze the full selected rules before viewing later-period results, and retain any universe changes with the test record.
Doubling down on the best Mswing strategy
I continued the conversation with the AI, starting with fetching a fresh list of stocks.
what are the top 100 stocks by market cap as of 2020?
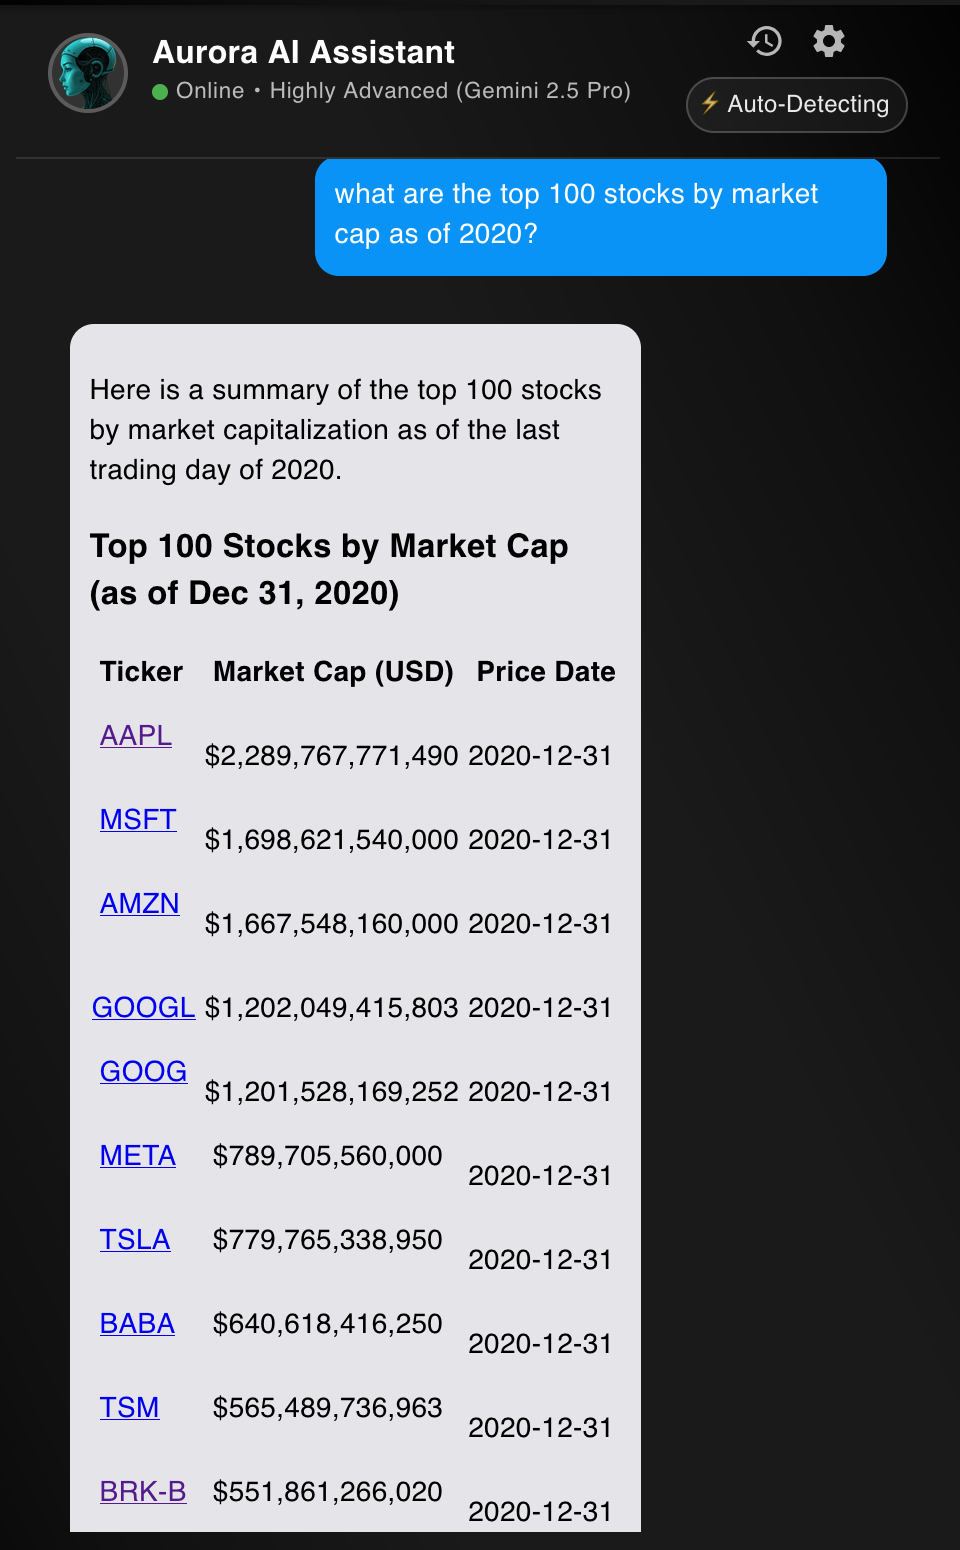
The rest is rinsing and repeating. I created a strategy, backtested it, and evaluated the performance.
Recreate the market cap momentum strategy using this new list of stocks. Remove BRK-A and GOOG from the list.
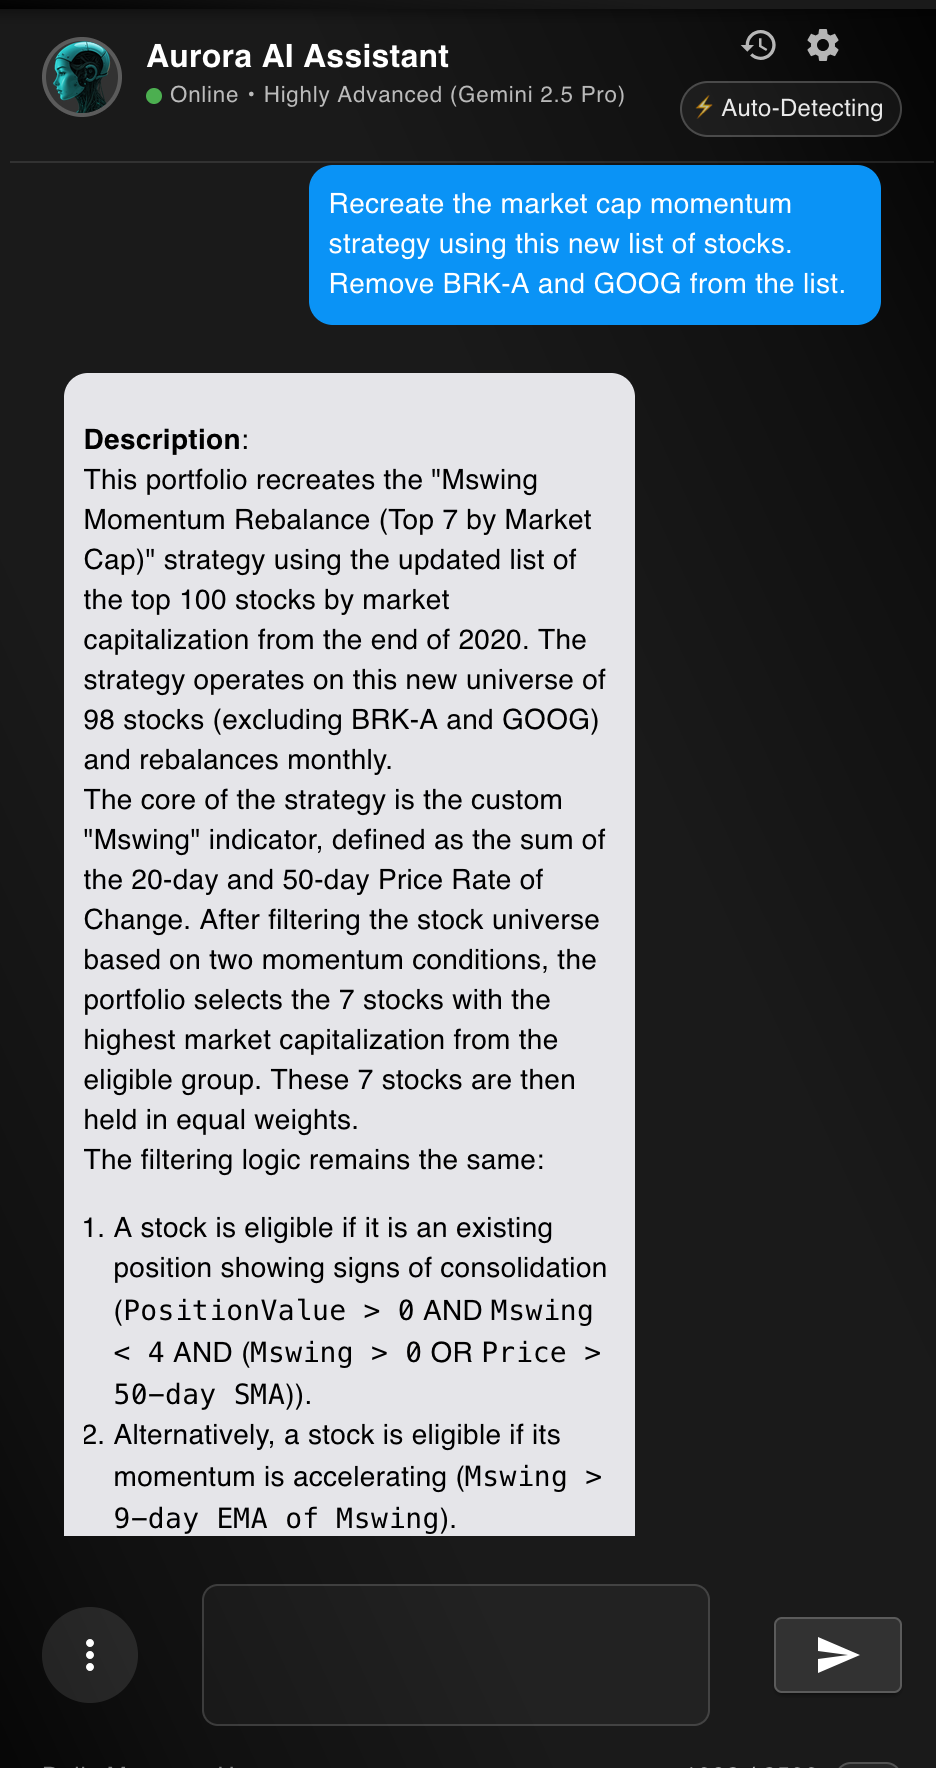
This is where things start to get wicked — in every single backtest, the strategy fails to outperform the broader market.
It actually does awful.
backtest this new portfolio from
* 01/01/2021 to 01/01/2022
* 01/01/2021 to 01/01/2023
* 01/01/2022 to 01/01/2023
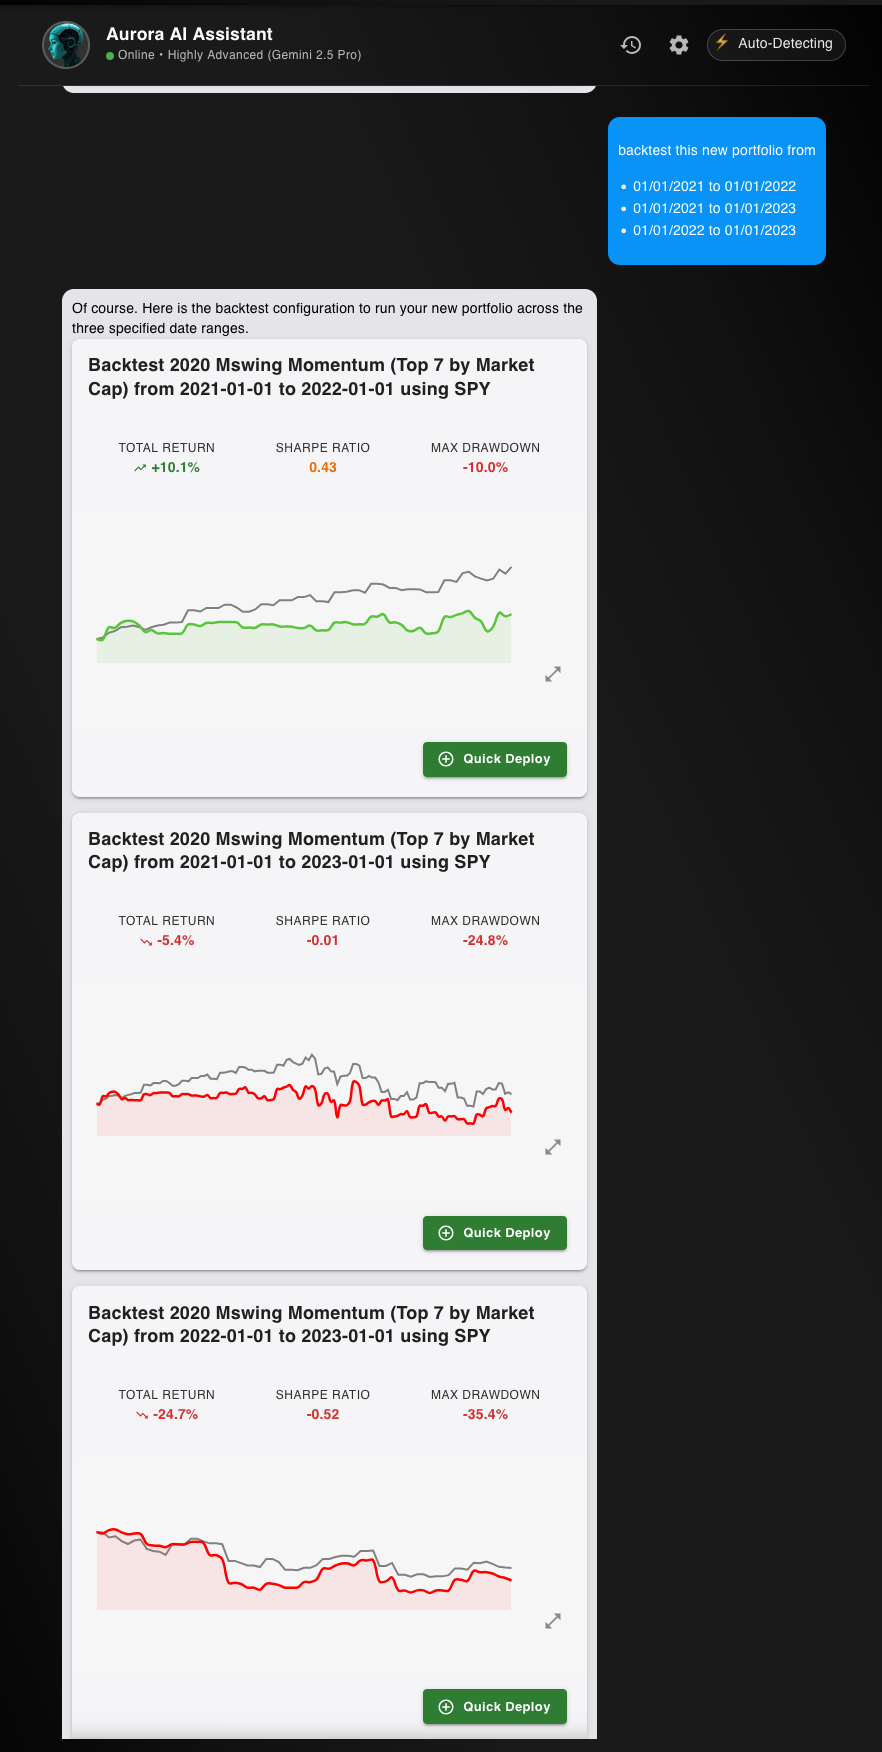
For the backtest from 01/01/2021 to 01/01/2022, the percent return is 10.10% (vs SPY’s 29.5%) and the sharpe ratio is 0.43 (vs SPY’s 1.5). In layman’s terms, that means that not only does the strategy not do as well as the broader market, but it also has inferior risk-adjusted returns.
You’re earning less money and taking on more risk.
The worst recorded peak-to-trough decline was 10.0% for this strategy versus 5.1% for SPY, nearly twice the decline. A larger drawdown is a larger loss from a previous peak.
Put simply, there’s literally no benefit to using this strategy. This pattern of underperformance in every key financial metric holds for the backtests from 01/01/2021 to 01/01/2023 and 01/01/2022 to 01/01/2023.
If this is the “one indicator to rule them all”, then technical analysis is cooked. In each of the backtest, the portfolio does worse than literally just holding SPY. This doesn’t even account for things like slippage and taxes.
The strategy sucks.
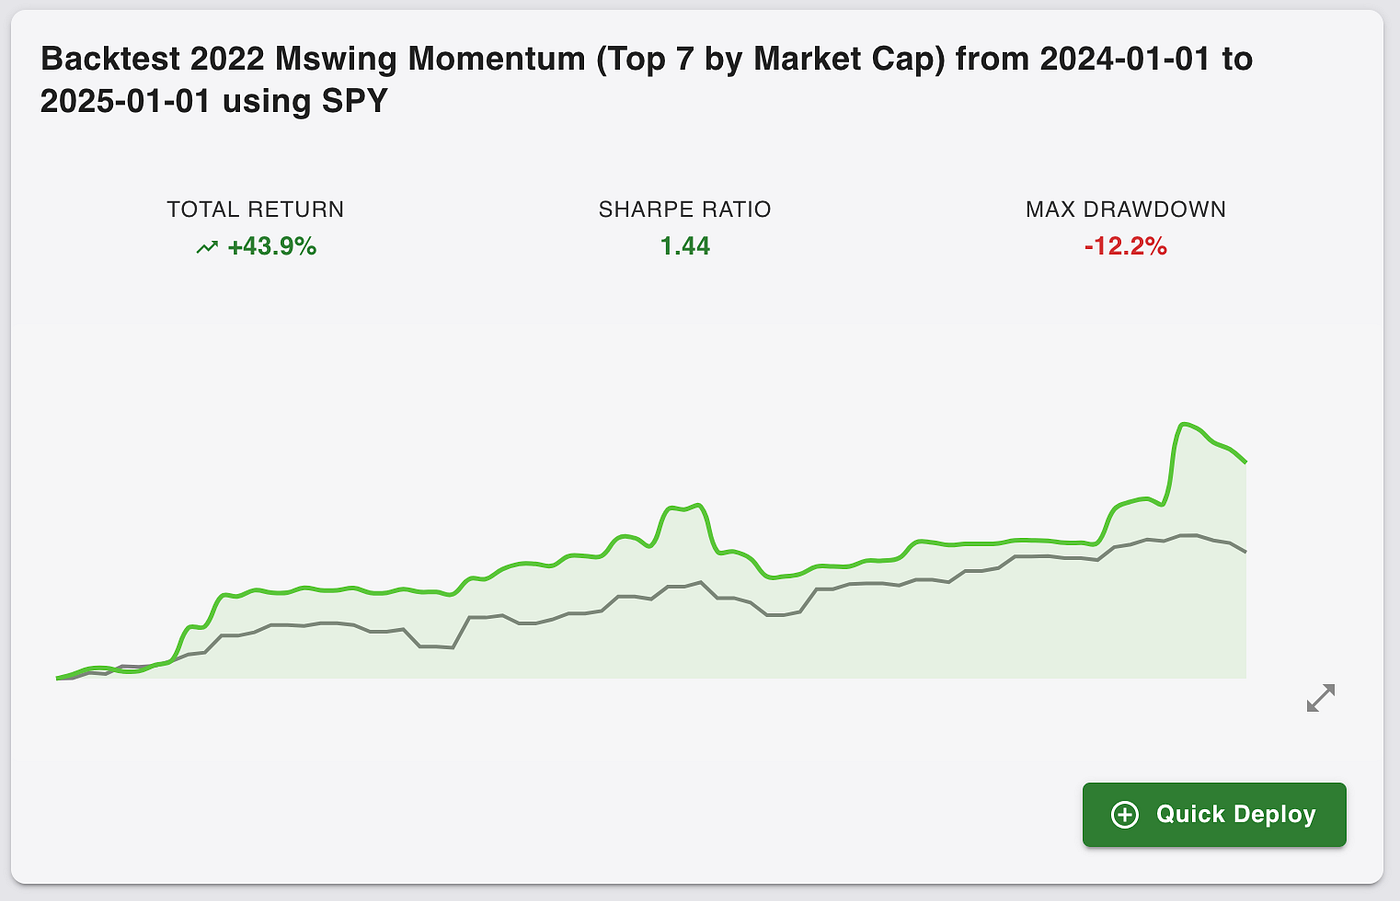
Redoing the process of fetching stocks, creating the portfolio, and performing backtests for 2022, the results are similar, with only one of the three backtests outperforming the market.
So what now?
Want to subscribe to the Mswing strategy and make your own changes? Clone it for free by clicking this link!
Discussion of these results
Look, I’m not here to pick on a writer. In truth, I enjoyed his article. It was easy to follow, it had code snippets, and it was a decently enjoyable read. Compared to the typical AI slop I read these days, it’s a fairly good article.
But this indicator sucks.
The article is all hype with no substance. While I’m not afraid to shy away from a clickbait title, I back up my claims with solid evidence. And in this case, there isn’t any.
Let me be clear — I have no incentive to bash this guy! In fact, just the opposite. Do you know how easy it is to monetize a portfolio that doesn’t work? It’s impossible. That’s why I’m sharing it for free.
Shared Portfolio: MSwing — the one indicator to rule them all
View and analyze trading strategy for portfolio
nexustrade.io
If someone makes an outrageous claim about an indicator being “one to rule them all”, chances are that they’re BSing. If it’s really true, then it should be easy to prove! So why can’t I make a consistently profitable strategy?
But hey, if I’m wrong, call me out! Leave a comment, create the strategy on NexusTrade, and share the portfolio. You can even monetize your strategy and earn passive income just for proving the claims that you made originally.

But you won’t… because you know you’re wrong.
Let this story be a cautionary tale — if a strategy seems too good to be true…
That’s because it is.
NexusTrade - No-Code Automated Trading and Research
Perform financial research and deploy algorithmic trading strategies
nexustrade.io
No comments yet.