I just gained access to the new and improved o1 model. Here’s how I’m using it to time the market
With the stock market down over 5% in the past week, many new investors are asking themselves this question:
Should I sell?

When most people answer this question, they are speculating based on gut feel or recent experience. Seldom do people actually look at the data in order to inform their investing decisions.
This leads to rash decision-making, fear, uncertainty, doubt, and poorer profits.
Today, I’m going to show you how to use historical data to help inform your decision-making process. This article will give you the tools to help you decide if you should buy more, hold, or sell during certain market conditions.
By following this guide, you’ll achieve greater confidence in your investing, calm your anxiety, and gain significantly more profits than you’ve achieved in the past.
Let’s get started!
How to Follow Along: a Google Collab for Investing
This article is designed to be interactive and give you the tools needed to make these types of decisions for yourself. Thus, I strongly encourage you to not just read, but follow along.
To do so, you’ll need to create a free NexusTrade account. NexusTrade is the platform we’ll use to perform the research to answer questions such as “should I sell during this pullback?”.
If you’re not able to create an account at this moment, not to worry! This article will contain plenty of screenshots and links that you can refer to.
One of the most important links is the direct link to the conversation I had with Aurora, the AI assistant that will help us perform this analysis. This direct link is more streamlined than this article and will remind you how to perform the analysis without you having to read this entire article.
This is vaguely similar to Google Collab, a platform coders use to share their scripts. With the conversation, you can continue from where I left off, copy the messages, and use it as a guide to perform your own analysis.
Finally, I encourage you to share this article with a friend to help me accomplish my mission of making data-backed systematic investing available to everybody, not just the “Wall Street Elite”.
Without further ado, let’s get started!
Experimental Setup: Our Choice of Language Model
This article will be comprised of three main objectives:
- Querying for financial data
- Performing financial analysis
- Running historical simulations
To do this, I will be using the brand new OpenAI O1 model. the O1 model is the successor to the O1-preview model. It support function calling, which allows us to generate synthetically valid objects — something useful for LLM applications.
The O1-model is a reasoning model, which means that it thinks before it answers complex questions. This is extremely useful for a financial application, where accuracy is paramount.
However, this thinking does have its drawbacks. For one, it's extremely slow, oftentimes taking several minutes to answer complex questions. It's also extremely expensive costing several times more than some of the other language models.
Within NexusTrade, the model we choose is configurable, meaning we could choose other models, depending on our use-case. This includes Sonnet 3.5 and Gemini Pro – two advanced language models from Anthropic and Google respectively.
Thus, we have to make trade-offs between speed, accuracy, and cost. For this article, to demonstrate the full capabilities of the stronger large language model, we are going to use the brand new O1 model.
To view the exact queries the model used, you can click the “View Stock Screener Debug Info” attached to the AI messages in the chat.

Using the O1 Model to Outperform the Market
By using the best language model, we can analyze the market with unprecedented speed and accuracy. Here’s how.
Within NexusTrade, the large language model is attached to a comprehensive financial database. The model acts as an interface between the database and the user. It transforms our user questions into queries, which are used to accurately answer our financial questions.

This is different than blindly asking ChatGPT. ChatGPT does not have access to real-time financial information. Thus, you can’t just hop onto the ChatGPT website to replicate this. You need a specialized platform like NexusTrade.
Now, let’s get started with our analysis.
Performing financial analysis
We’re going to use Aurora to figure out what to do during a market downturn.
To start, I’m going to ask the following question:
Since Jan 1st 2000, how many times has SPY fallen 5% in a 7-day period? In other words, at time t, how many times has the percent return at time (t + 7 days) is -5% or more.
Note, I’m asking 7 calendar days, not 7 trading days.
In the results, include the data ranges of these drops and show the percent return. Also, format these results in a markdown table.
Here is a snapshot of the results from the model.

As a reminder, you can view all of the full results by clicking this link.
This analysis shows us that SPY falling this much is relatively rate. Since Jan 1st, 2020, this has occurred 150 times. Many of these drops are centered around the US Financial Crisis and the Covid pandemic. However for the most part, they are distributed relatively evenly.
Let’s dig a little deeper.
Analyzing how low the market can go
After a 5-day drop, the thing we’re most concerned with is this:
How long can it really go?
Let’s find out.
The next question I asked sought to determine the drawdown within the next year. I asked the following:
From each of these start dates, what was the max drawdown within the next 180 days? What about the next 365 days?

Because the model outputted the full table, I asked it to summarize the data.

These results are extremely informative. Since Jan 1st 2020, if the stock market fell 5% or more, the average drawdown a year later was nearly 20%. What this means is that from the start date of the fall, the market could keep going, potentially tripling the damage to your portfolio.
Does this hint at the fact that you should sell when confronted with a little bit of volatility?
Not necessarily.
Analyzing what can happen if we continue to hold
From the above analysis, we know that markets can continue to crash during a large drawdown. But, that doesn’t mean we should sell.
To prove this, I’m going to ask the model the following.
From each of these end dates from the analysis, what was the percent return within the next 180 days? What about the next 365 days?

From this, we can see the average return half a year and a full year later. This data is too much for us to analyze, so we’ll similarly summarize it to get the key points.
What is the average 180 day return and the average 365 day return, and how does it compare to the 7 day percent drop?

From this, we can see something pretty interesting: the market tends to rebound after a steep drop.
Even though the maximum drawdown can be 2x to 4x the initial drop, we can see that the market tends to revert course.
Note, that this analysis includes historical drops that had obvious macroeconomic conditions that facilitated the drop, including the 2008 Financial Crisis and Covid-19. Thus, we may be able to exclude this data to get a more accurate analysis.
I’ll leave this as an exercise to the reader 😉.
Transforming these insights into trading algorithms
So far, I’ve shown you how to perform detailed financial analysis using an LLM tool. However, capturing the value of these tools is the most important aspect.
I’m going to show you how to translate this analysis into trading strategies.
Updating our experimental setup
To do this, I’m going to change the model to GPT-4o-mini. For tasks that don’t require reasoning, the GPT-4o-mini is more than capable of doing the task. This includes creating algorithmic trading strategies. It’s also much faster and cheaper.
I’ll also update the Quicktest settings so that the resulting backtests is more applicable for what I’m trying to test — a market-beating trading strategy at the height of a market downturn.

Creating our trading strategies
Now, I’m going to use these insights to create a market-beating trading strategy.
Our trading strategies will capitalize on the fact that the markets tend to go up in the long-term, even in the face of large drawdowns. The rules I will choose are as follows:
- Buy 50% of our buying power in SPXL if we have less than $500 of SPXL positions
- Sell 20% of our portfolio value in SPXL if we haven’t sold in 10000 days and our positions are up 10%
- Sell 20% of our portfolio value in SPXL if the SPXL stock price is up 10% from when we last sold it
- Buy 40% of our buying power in SPXL if our SPXL positions are down 12% or more

This portfolio is MUCH more volatile than holding SPY and experiences drawdowns of up to 26% (a fact that I aligns with what we discovered earlier in this article).

However, if we held and kept holding, the leveraged strategy eventually goes up.
In fact, it doesn’t just do well. If you wait 2 years and don’t do ANYTHING (but hold), it dominates.
And significantly outperforms the broader market.

The great part about this portfolio is that it doesn’t Just do well when the market turns against us — it does just as well in bull markets as well.

Fair warning: this strategy has performed well in the past. This does not mean it’ll absolutely perform well in the future. Different market conditions result in different changes in stock price.
For example, if a nuclear war broke out or the AI robots take over, that could cause prolonged downturns in the market. This strategy counts on the fact that the market tends to go up in the long-term, and if this doesn’t happen, this strategy will do particularly poorly.
Now, if we do decide that this strategy was perfect for 2025, we could deploy it live. This could be paper-trading, a way to test a strategy live without risking actual money. Or, we could connect a brokerage, and see how this portfolio performs in the actual stock market.
Here’s how to deploy it live.
Step 1 (Optional): Create an Alpaca account and enable live-trading
This step is only necessary if we want to deploy our portfolio to the live market.
Within NexusTrade, there are two deployments: paper-trading and live-trading.
Paper-trading is like playing with monopoly money. It allows us to see how our portfolio performs without any risk. It’s our best form of testing, and gives a no-BS view of the performance of our strategy.
In contrast, live-trading is not a test. We are actually executing our trades in the stock market. When we’re ready to take this leap, we first have to do a little bit of setup.
First, we’ll navigate to the live-trading page.

Then we’ll click the Connect with Alpaca button and follow the instructions on the screen.

Once our Alpaca account is created and connected with our NexusTrade account, we can customize our portfolio with trading strategies.
Step 2): Add automated trading strategies to our portfolio
In this next step, we can add our strategies to our portfolio. We can do this for both paper-trading and live-trading depending on our specific goals. To do this, we’ll first click on the portfolio we created.

This opens a modal that allows us to update our strategies or add them to a portfolio. This includes creating a new portfolio, adding them to our live-trading Alpaca Portfolio, or adding them to a paper-trading portfolio.

After selecting a portfolio, we then click “Add to Portfolio” and our strategies will be ready to launch!

Now, it’s time to deploy our portfolio live to the market.
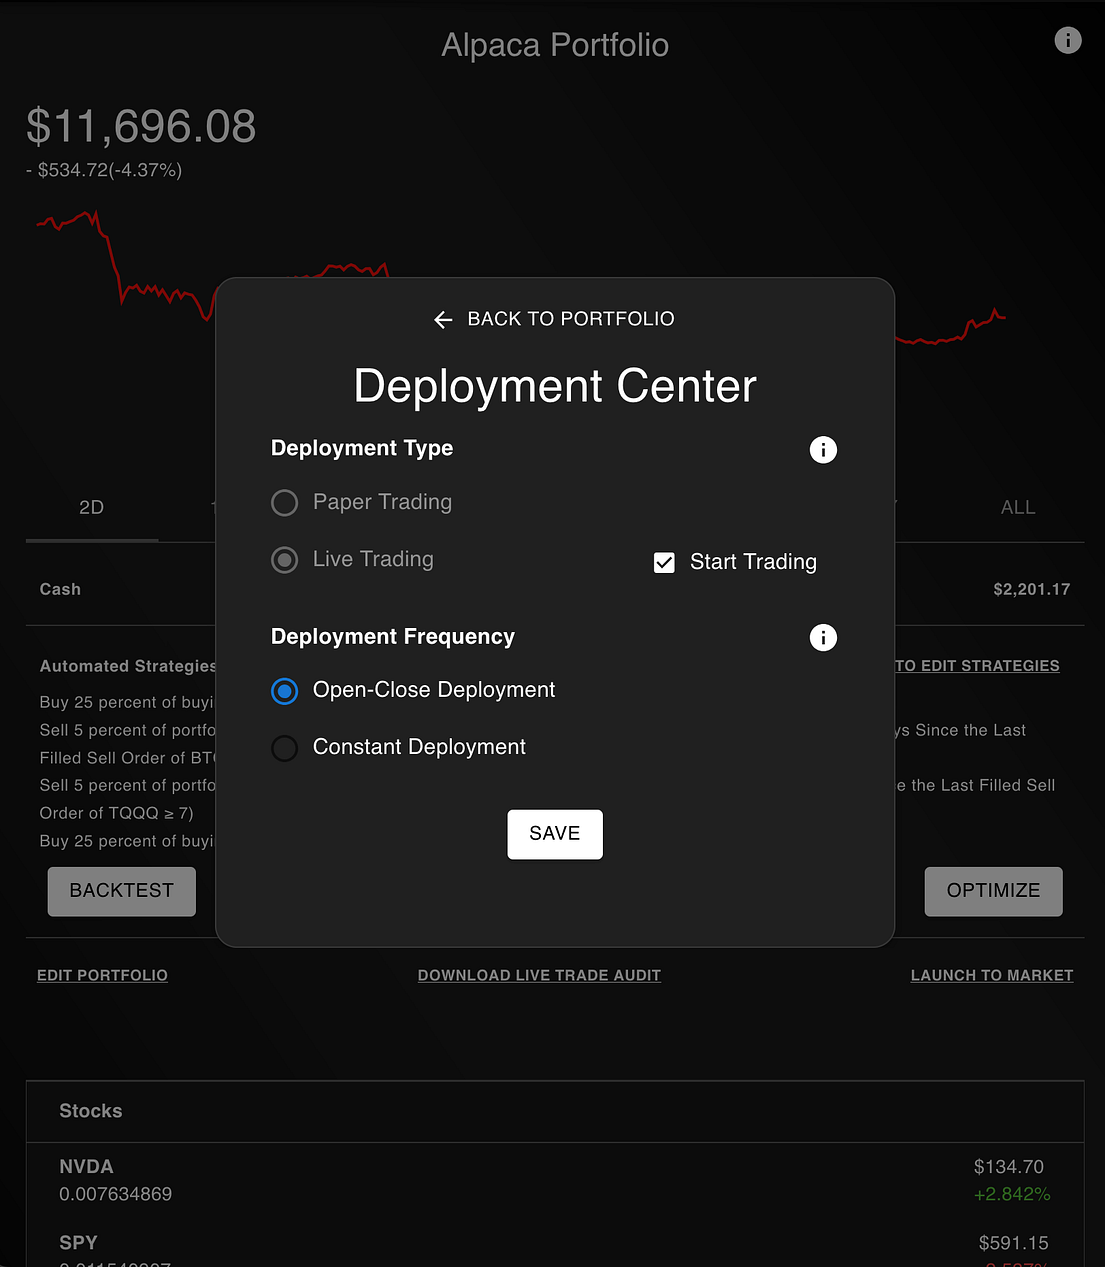
Step 4): Deploy our strategies to the market
Our final step is to actually deploy our portfolio, which is extremely easy. Regardless if we’re paper-trading or live-trading, we’ll navigate to our portfolio page, and click “Launch to Market”. This opens a modal and allows us to deploy our trading strategies.
Now, you’ve just launched a data-driven algorithmic trading strategy to the market. Congratulations!
Warnings and Disclaimers
This article would be incomplete without a warning: the past doesn’t necessarily predict the future.
The purpose of this article isn’t to convince you to go all in after the first biggest drop. It’s to show you how to perform data analysis to make more informed investing decisions.
Nonetheless, this article has limitations. The biggest limitation is the accuracy of the models. Even other powerful LLMs like Claude 3.5 Sonnet and Gemini Pro pale in comparison to a reasoning model like GPT o1. For example, when I use Claude Haiku, I get a result like the following.

If we zoom in and examine the query, we’d notice something completely wrong with the query.

Instead of accurately counting 7 calendar days, it uses LEAD(…, 7). This explicitly gives us 7 trading days, which is not what we asked for.
Moreover, as I mentioned before, the past doesn’t necessarily predict the future. What happened during the 2008 Financial Crisis and the COVID-19 pandemic was unprecedented, and the resulting volatility of the market was too. If we were to enter into any sort of long multi-year depression, the strategies presented in this article would be particularly susceptible to drawdowns.
Nonetheless, this article still serves its purpose as a useful guide for people who want to get started with automated investing and financial research.
Concluding Thoughts
The purpose of this article is not to convince you to buy stocks during a drawdown or sell stocks because it can get much worse. It's to show you simple it is to perform stock analysis to empower you to make those decisions for yourself.
Thanks to the new OpenAI o1 model, investors, like you can perform accurate analysis with unprecedented speed, without having to write a single line of code.
You can then transform your insights into a trading strategy, and use that strategy to significantly outperform the market.
Overall, it gives you a glimpse of how to become a better investor by using a objective data. The time that O1 saved is phenomenal. reasoning is simply unmatched, and will transform how businesses utilize this new frontier of models.
And I couldn't be more excited to witness this.
If you made it this far, you MUST be interested in algorithmic trading or financial research. Thus, I ask you to please share this article on social media, and with a couple of your close friends. It helps spread my reach and directly supports me in accomplishing my mission to make Wall Street tools accessible to everyone, regardless of their financial or technical background.
And isn’t that a mission worth supporting?
Thank you for reading! If you’d like to keep up with my work or connect with me, here’s how.
LinkedIn | X (Twitter) | TikTok | Instagram | Newsletter
No comments yet.