
Algorithmic Trading Fundamentals · Module 2 of 6
Why technical analysis alone will lose you money.
RSI says oversold. MACD confirms. You buy. The company just announced four straight quarters of declining revenue. Guess which signal wins.
 Austin Starks
✦ Founder, NexusTrade
✦ April 2026
✦ 12 min read
Austin Starks
✦ Founder, NexusTrade
✦ April 2026
✦ 12 min read
A Real Trade
On April 9th, I bought one GOOG call for $644. Six days later I sold it for $2,100.
That's +226% in under a week. Not because of a hunch. Because of a thesis.
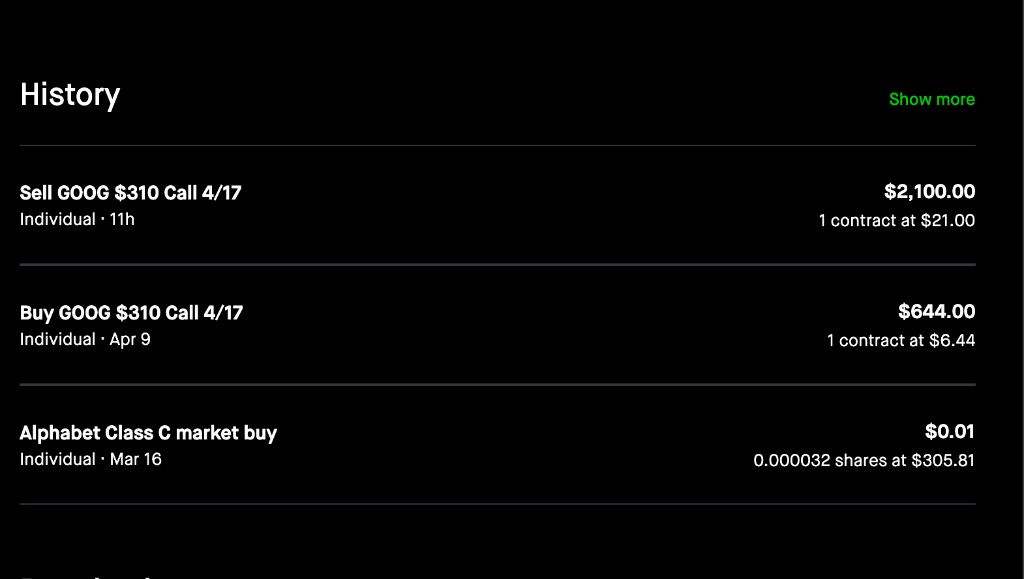
Robinhood · Sell GOOG $310 Call · 1 contract at $21.00 (+226% in 6 days)
The thesis started with fundamentals. Aurora rated Google 4.5/5: Q1 2025 revenue at $90.2B, net income $34.5B, a P/E cheaper than Apple, and a $155B cloud backlog that most people weren't paying attention to. Berkshire had just bought in. Google I/O had just aired. The indicators said one thing. The market, briefly distracted by tariff noise, said another.
I had the same conviction with NVIDIA. I've written about holding through a $16,649 drawdown and buying more. The account is now up $65,387 all time. This week alone: +25.99%.
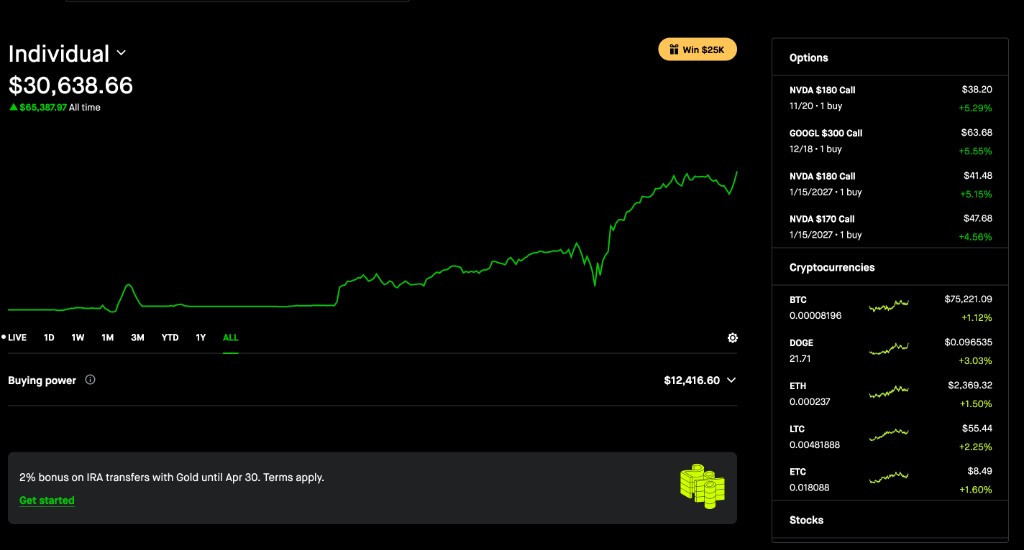
Robinhood Individual Account · $30,638.66 · +$65,387.97 all time · Active: NVDA calls + GOOGL call
Both trades came down to the same thing: indicators. An indicator is just a number. Revenue. Net margin. P/E ratio. Cloud backlog. None of these numbers mean anything in isolation. But arranged correctly, they tell you when the market is wrong about a company. That gap is where the trade lives.
This module is about indicators: where they come from, what they actually measure, and how to turn raw data into the kind of conviction that lets you hold when everyone else is selling.
Caution — Technical Indicators Alone
Technical analysis is the most widely taught form of market analysis. It is also incomplete. Stock market returns are non-stationary: the patterns that predicted price movement in 2018 may not predict price movement in 2024. Technical indicators are a starting point. The GOOG trade was built from revenue growth, valuation multiples, and a catalyst. RSI had nothing to do with it. You need both.
Watch · What is a Trading Indicator? — The Building Blocks of Algorithmic Trading
Type 1
Technical indicators: reading the story in the price.
Technical indicators use a stock's price and trading history to generate signals. They operate under the key assumption that price patterns tend to repeat. There are two opposite philosophies inside technical analysis, and understanding both is essential.
One often-overlooked technical indicator deserves mention before we get to the philosophies: volume. Volume tells you how many shares traded hands in a given period. A price move on high volume means institutions are behind it. The same move on low volume is noise. Volume is the bridge between technicals and fundamentals — it shows whether the smart money is confirming a move or ignoring it.
Philosophy 1: Mean Reversion
Mean reversion says that stocks have a "natural" price range, and that when a stock strays too far from that range, it tends to come back. If a stock is significantly below its average price, it's likely to recover. If it's significantly above, it's likely to pull back.
Common mean-reversion indicators include:
- Simple Moving Average (SMA): the average closing price over N days
- Exponential Moving Average (EMA): like SMA but weights recent prices more heavily
- Bollinger Bands: price envelope ±2 standard deviations from the moving average
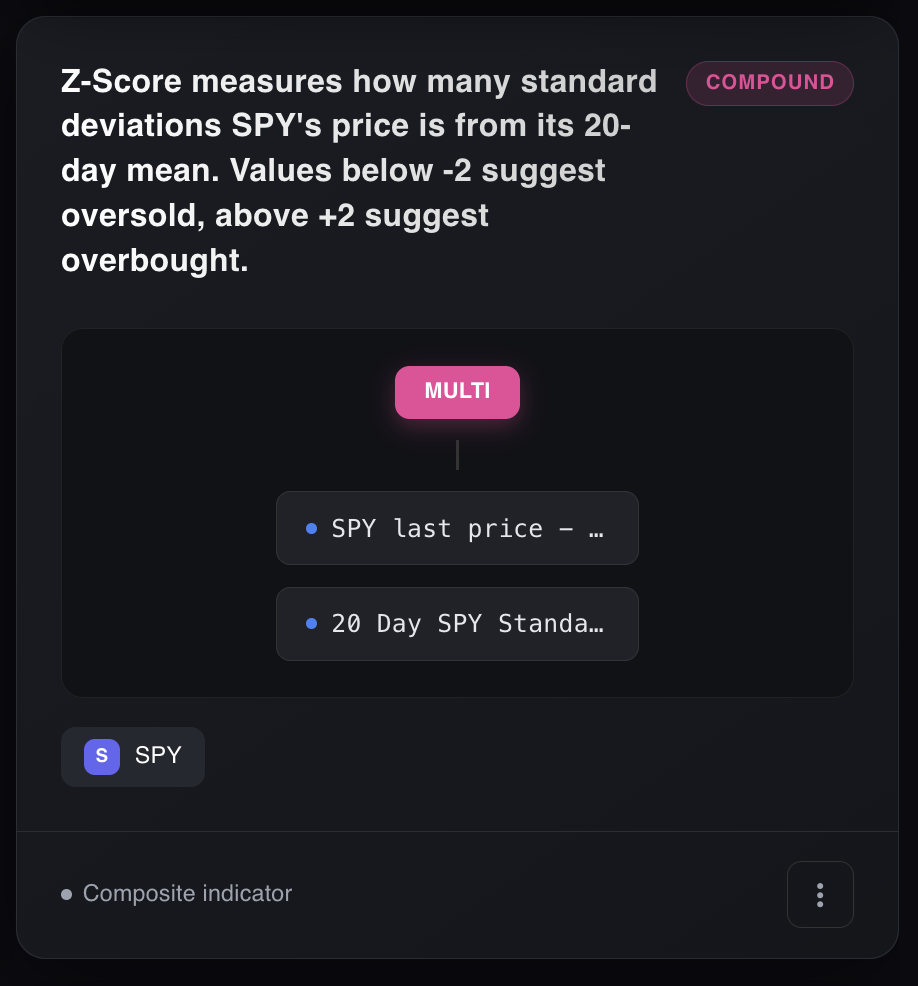
- Z-Score: how many standard deviations the current price is from its N-day mean
Philosophy 2: Momentum
Momentum indicators have the opposite thesis: if a stock is moving in a direction, it's likely to keep moving in that direction. Stocks that are trending up tend to continue up. Stocks in a downtrend tend to continue down. Buy the strong, avoid the weak.
Common momentum indicators include:
- RSI (Relative Strength Index): measures the speed and magnitude of price changes on a 0–100 scale. Above 70 is overbought. Below 30 is oversold.
- MACD (Moving Average Convergence Divergence): compares two EMAs to identify trend direction and momentum shifts
Watch · What Are Technical Analysis Indicators? — Mean Reversion vs Momentum
Mean reversion and momentum are opposites. They can't both be right at the same time. Which one you use depends on market conditions — and professional traders often use both simultaneously on different time frames.
MEAN REVERSION STRATEGY LOGIC
Core belief: Price always reverts to its average. Extreme deviations are temporary.
Buy signal: Price drops significantly below its N-day moving average (e.g., Z-score < -2)
Sell signal: Price rises significantly above its N-day moving average (e.g., Z-score > +2)
Works best in: Sideways, range-bound markets. Choppy conditions.
Fails in: Strong trending markets — a stock can stay "oversold" for months during a bear market.
MOMENTUM STRATEGY LOGIC
Core belief: Stocks that are moving up will continue moving up. Strength begets strength.
Buy signal: RSI crosses above 50 and rising, MACD crossover, price breaking all-time highs
Sell signal: RSI drops below 50, MACD crossover to downside, trend line broken
Works best in: Trending bull markets. Strong sector rotations.
Fails in: Sideways markets — generates false signals and whipsaws.
Type 2
Fundamental indicators: the only way to know what a stock is actually worth.
Watch · What Are Fundamental Indicators? — Understanding a Company's Financial Health
Technical indicators tell you how a stock is moving. Fundamental indicators tell you why a stock should be worth what it's worth. And over the long run, the fundamentals win.
A stock represents a business. If you want to predict where a stock will be in five years, you need to understand the underlying business. Is it growing? Is it profitable? Is it trading at a fair price relative to what it earns?
"Fundamental indicators are ways to evaluate a company's financial health. They ask: is this company actually healthy? Is it likely to make money next year?"
The key metrics come from a company's financial statements — specifically earnings reports filed every quarter. But it's not just the raw numbers. It's the ratios and calculations derived from them.
The fundamentally strong stock checklist
Professionals look for stocks that pass multiple fundamental screens at once:
Key insight
Fundamentals have one real weakness: they are lagging. Earnings reports come out every three months. Price moves every second. By the time the report confirms what you suspected, the move is often over. This is why you use fundamentals to decide what to buy and technicals to decide when to buy it. The combination is what separates durable strategies from lucky ones.
Type 3
Economic indicators: the invisible tide that lifts or sinks every stock.
Every stock exists inside an economy. And the health of that economy — interest rates, inflation, employment, growth — has a profound effect on how stocks perform overall. Economic indicators let you measure that macro environment and factor it into your trading decisions.
The most important economic indicators to understand:
- Federal Funds Rate: when the Fed raises rates, borrowing gets expensive, growth stocks get punished, value stocks tend to hold up better
- CPI (Consumer Price Index): the primary inflation gauge; high inflation historically hurts equity valuations
- Unemployment Rate: high unemployment often precedes economic slowdown and market weakness
- Yield Curve: when the 2-year yield exceeds the 10-year (inverted), recession has historically followed within 12–18 months
Type 4
Alternative data: if it evaluates to a number, it can be an indicator.
In the late 2010s, a number of hedge funds started purchasing satellite imagery data. Not maps — live satellite feeds, updated daily. They pointed those satellites at Walmart parking lots. They counted the cars. And then, before the quarterly earnings report came out, they knew. More cars means more revenue. And if you know the earnings report is going to beat expectations before it drops, you have an edge.
Real examples used by institutional investors
Satellite imagery: count cars in retail parking lots, shipping containers in ports, oil in storage tanks
Credit card data: anonymized consumer spending trends that predict earnings before reports
Job postings: a company aggressively hiring engineers signals growth; sudden layoffs signal contraction
Web traffic: shows when a company's site is gaining or losing users before revenue shows it
Social sentiment: Reddit, StockTwits, Twitter/X, YouTube mentions, comment sentiment scores
The point is the concept: any observable phenomenon that maps to a number is fair game as an indicator. Combined with Aurora, which can research the market and update your strategies based on what it finds, you have a system that goes well beyond price charts. Connect a Public.com account to get 3 months of Premium free.
Watch · What Are Alternative Data Sources? — Economic Indicators, Sentiment Data & More
The big picture
All four types of indicators — technical, fundamental, economic, and alternative — can be combined in a single strategy. Technical indicators time the entry. Fundamentals pick the right companies. Economic indicators filter for the right market environment. Alternative data finds edges everyone else misses. In Module 3, you'll learn how to turn all of these signals into conditions and actions.
Part of the free course
Algorithmic Trading Fundamentals
6 modules · No code required · Connect Public.com for 3 months Premium free
Check Your Understanding
Three questions to lock this in.
Question 1
A stock's RSI just dropped below 30. A mean reversion trader might see this as a buy signal. What important information is RSI missing that could make this trade a disaster?
Question 2
Company A has a PE ratio of 12. Company B has a PE ratio of 85. Both are in the same sector. What does this tell you — and what doesn't it tell you?
Question 3
A hedge fund buys satellite data to count cars in retail parking lots before quarterly earnings. Which of the four indicator categories does this fall into, and why?
Aurora can help you create technical, fundamental, economic, and alternative data indicators in plain English. No formula memorization required.
Get 3 Months Premium Free — via Public.comOpen a Public.com brokerage account, connect it to NexusTrade, and get 3 months of Premium free. · Or take the full course →
No comments yet.