
Algorithmic Trading Fundamentals · Module 5 of 6
The professional's edge: backtesting, optimization, and going live.
Your strategy sounds great. You've convinced yourself it works. Here's how to find out if it actually does, and what to do when you're ready to deploy.
 Austin Starks
✦ Founder, NexusTrade
✦ April 2026
✦ 14 min read
Austin Starks
✦ Founder, NexusTrade
✦ April 2026
✦ 14 min read
The Hard Part
A profitable backtest is not the same as a good strategy. This module teaches you how to tell the difference.
I'm up $60,000 because I know how to backtest.
Every strategy, before a single dollar went live, got tested. But I also never trusted a backtest the way a lot of people do. Not as proof that something works. A backtest tells you a strategy wasn't obviously broken in the past. That's it. Whether it works going forward is a separate question.
Most people learn this the hard way. You build a strategy. You run a quick test. It shows 42% returns over the last two years. You're excited. You deploy it with real money. Three months later, you've lost 25%.
That's not bad luck. It's a misunderstanding of what a backtest actually tells you, and what it doesn't.
This module covers everything you need to evaluate your strategy honestly and optimize it without fooling yourself. By the end, you'll know exactly what separates a strategy worth deploying from one worth deleting.
"A good trading strategy isn't just a strategy that makes money. You have to consider your alternative investment ideas."
The benchmark is simple: over the past 100 years, the S&P 500 has averaged roughly 10% per year. Building a trading strategy is a lot of work. If your strategy doesn't consistently beat that on a risk-adjusted basis, you'd be better off buying one ETF and doing nothing.
Performance Metrics
Three numbers that actually tell you whether a strategy is good.
Watch · What Makes a Trading Strategy Good? — Benchmarks, Sharpe Ratio & Drawdown
Most beginners evaluate strategies on a single metric: total return. But total return without context is nearly meaningless. A strategy that returned 40% but had a -60% drawdown at one point is not the same as a strategy that returned 28% with a -17% drawdown. The second one is probably better.
Professionals use three core metrics to evaluate risk-adjusted performance:
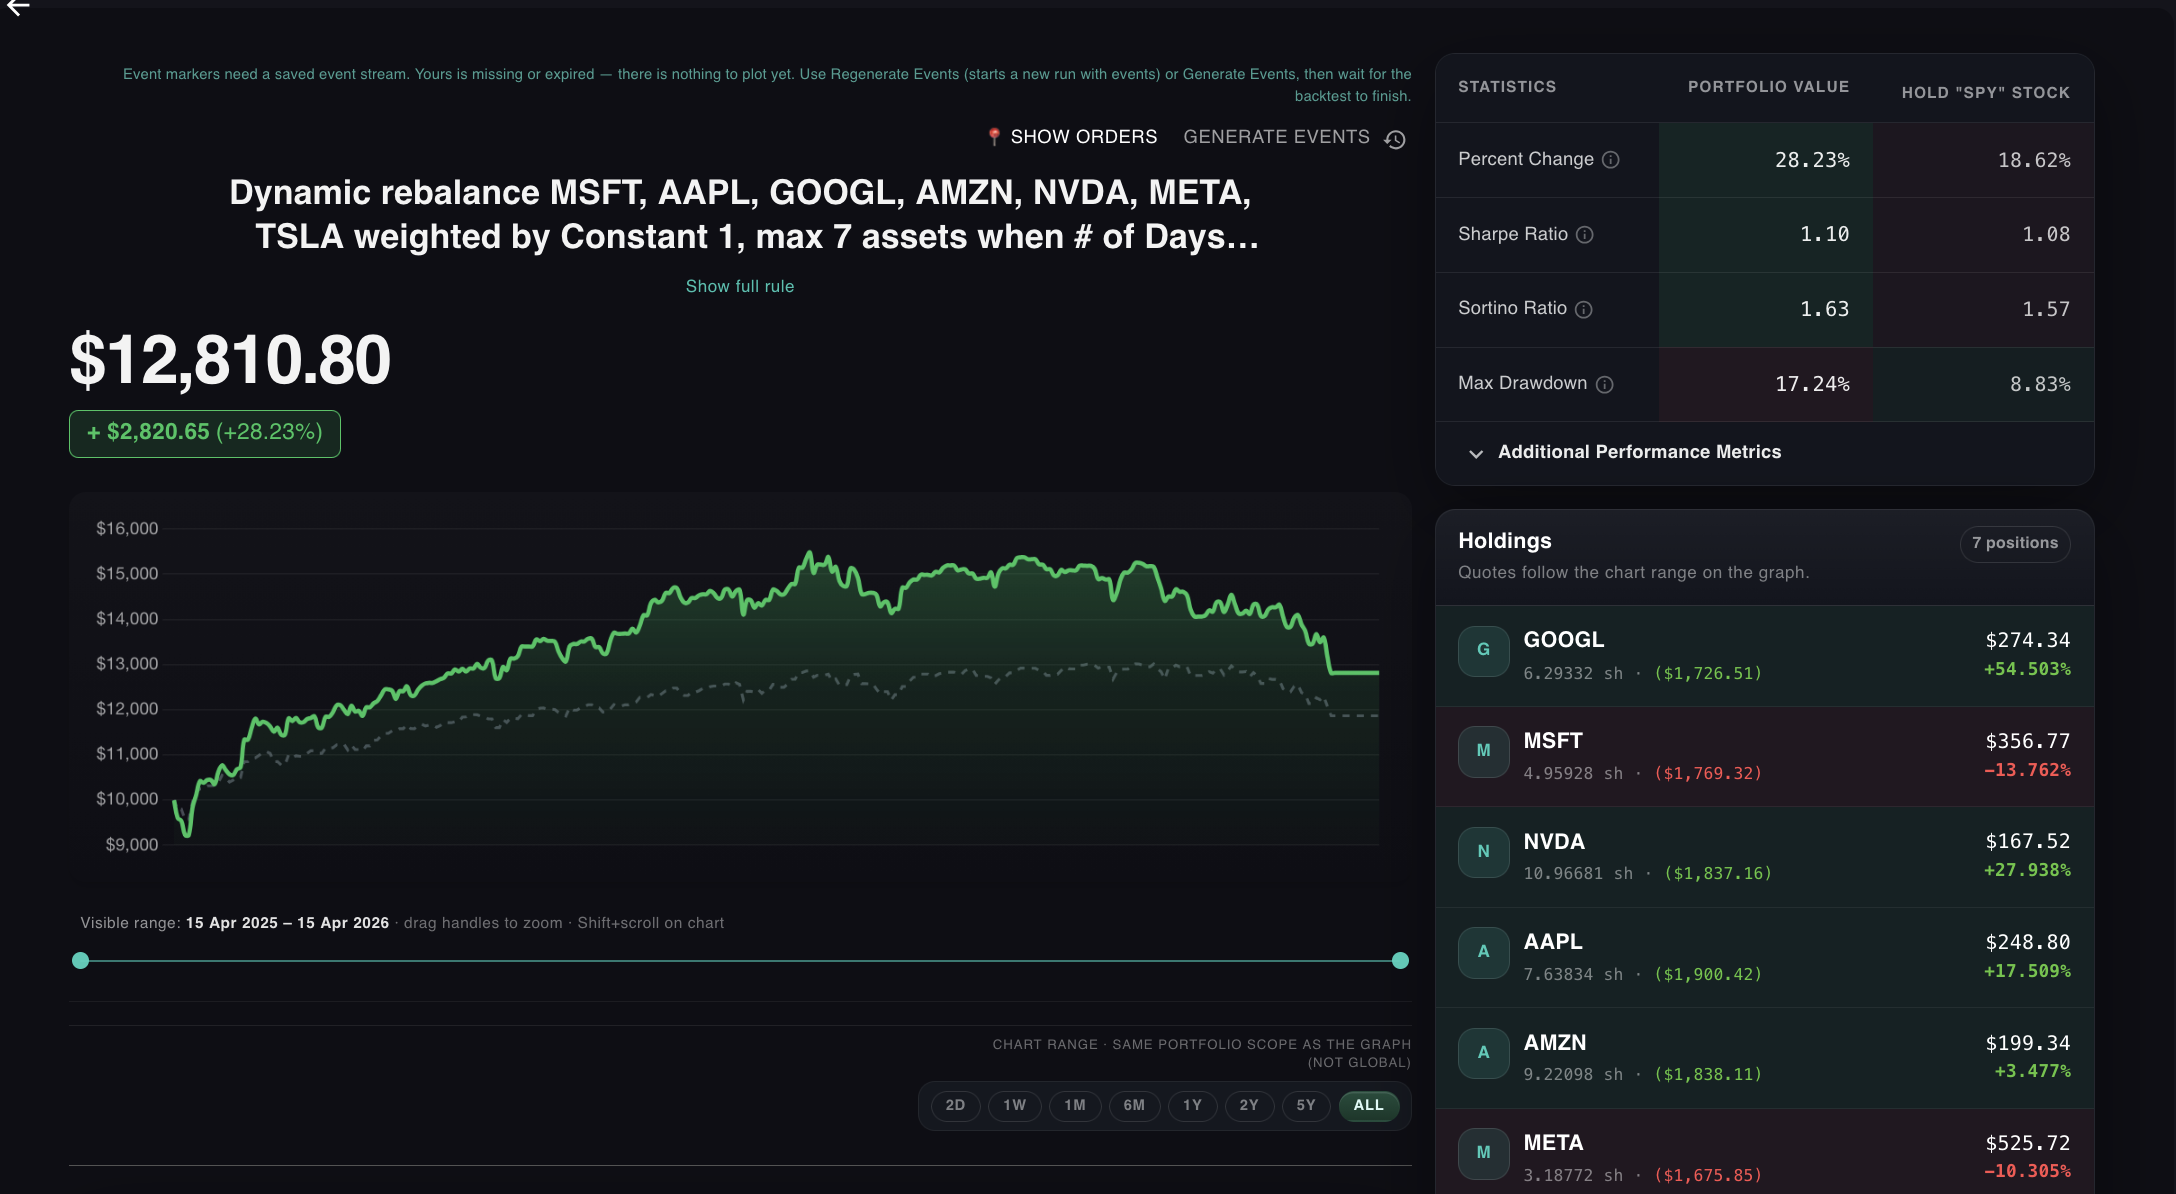
You can run this same test on your own strategy with a NexusTrade Premium account. Connect a Public.com brokerage account to get 3 months free.
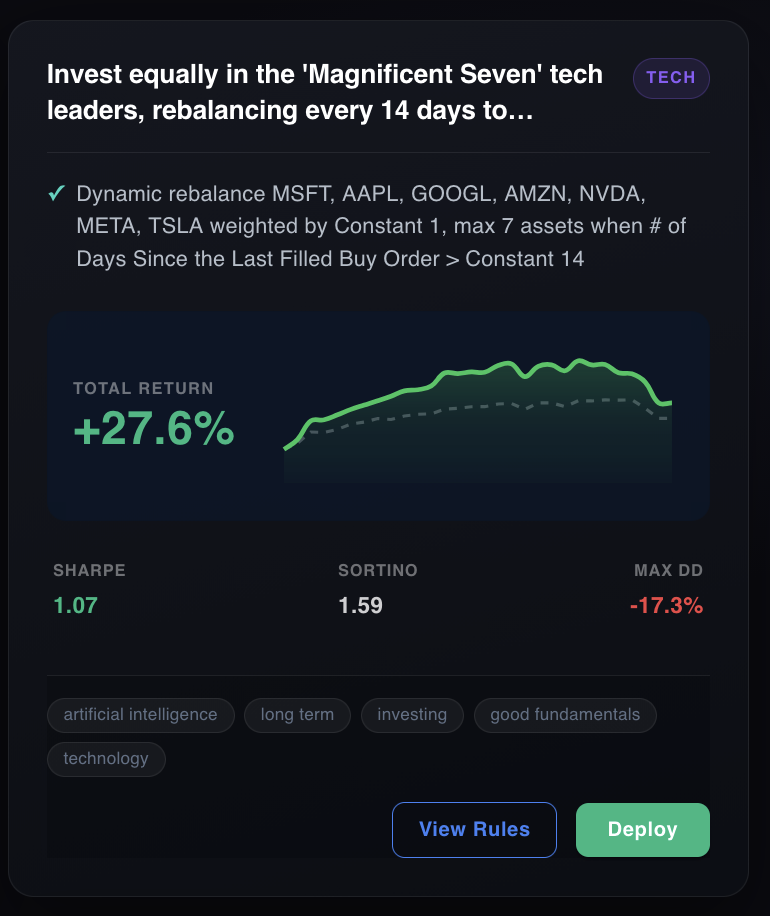
The Magnificent Seven rebalancing strategy above shows what a solid result looks like. +27.6% total return. Sharpe of 1.07 means every unit of volatility is being rewarded. Sortino of 1.59 means downside volatility is well-controlled. Max drawdown of -17.3% is painful but survivable. Most people can hold through that.
Other metrics worth knowing
Sharpe, Sortino, and Max Drawdown are the essentials. Professional quants also track: Alpha (return above the market benchmark), Beta (sensitivity to market swings), Calmar Ratio (annualized return divided by max drawdown, useful for comparing strategies with different risk profiles), Win Rate (percentage of trades that close profitable), and Profit Factor (gross profit divided by gross loss; anything above 1.5 is healthy). NexusTrade surfaces the most actionable of these in the QuickTest and full backtest views.
Stress Testing
What a backtest actually tells you. And the two ways it can lie.
Watch · What is Backtesting? — How to Test Your Trading Strategy
A backtest is a historical replay of how a set of trading rules would have performed over a specific period of the past. It's one of the most powerful tools in algorithmic trading. And one of the most dangerous if you misread it.
Lie 1: Past performance = future performance
Stock market returns are non-stationary. A strategy that worked brilliantly in a bull market may be catastrophic in a bear market. A strategy perfectly tuned to the 2020–2024 AI boom may have no edge at all in the next cycle. The backtest tells you how it would have worked, not how it will work.
Caution: Survivorship bias
Survivorship bias means your backtest only includes stocks that are still trading today. The companies that went bankrupt, got delisted, or were removed from the index aren't in your dataset. You're testing exclusively on survivors, which makes any strategy that buys and holds look better than it actually is. The losers have already been quietly erased from the sample.
Lie 2: A good backtest means it will work everywhere
Test your strategy across different time periods, not just the one where it looks best. A strategy that outperforms in every 1-year window from 2020 to 2024 is very different from one that only looks good from 2021 to 2023. Robust strategies hold up. Fragile ones don't.
Lie 3: The backtest assumes perfect fills
Most backtests assume you bought and sold at the exact closing price with zero fees. In reality, there's a bid-ask spread on every trade, and large orders move the market against you. This is called slippage. A strategy that trades frequently in small-cap stocks can look great in backtest and underperform significantly live because the backtest never paid the spread.
Watch for this
The higher your trade frequency and the less liquid your target assets, the more slippage matters. A rebalancing strategy that trades monthly in large-cap ETFs has minimal slippage risk. A strategy that trades every hour in penny stocks has a gap between backtest and live that may never close.
Key insight: What backtesting is actually good for
Backtests are invaluable for filtering out strategies that are clearly broken. If a strategy loses money consistently across every 2-year window you test it on, you don't need to deploy it. Backtests can't tell you a strategy will win. But they're very good at telling you when a strategy is likely to lose.
Tuning — Carefully
Optimization makes your strategy better. Overfitting makes it useless.
Watch · What is Strategy Optimization? — And How to Avoid Overfitting
Once you have a working strategy, you may want to improve it by tweaking its parameters. If your strategy buys when RSI drops below 35, what happens if you use 30? What about 40? What SMA period maximizes Sharpe ratio? Optimization answers these questions automatically by trying hundreds of parameter combinations and returning the best one.
But there's a trap. A strategy perfectly optimized on 2020–2024 data is often completely useless in 2025. The optimization found parameters that fit the specific conditions of those years. It didn't find a universal edge.
Warning — The most dangerous mistake in optimization
If you optimize your strategy on 2020–2025 data and test it on 2020–2025 data, you will almost always get a great result. This is meaningless. Hold out a period the optimizer never saw. Test your strategy on that. If it falls apart on data it hasn't seen, the strategy is fragile, not good.
The rule of thumb: use 70% of your historical data for optimization, and test the result on the remaining 30% that the optimizer never touched. If the strategy holds up on both, you have something real. If it collapses on the hold-out period, keep iterating.
Part of the free course
Algorithmic Trading Fundamentals
6 modules · No code required · Connect Public.com for 3 months Premium free
Check Your Understanding
Two questions before you deploy.
Question 1
A strategy shows a Sharpe ratio of 0.3 and a max drawdown of -52%. Another shows a Sharpe of 1.4 and a max drawdown of -14%. The first strategy returned 38% and the second returned 22%. Which would you rather deploy, and why?
Question 2
You optimize your strategy on data from 2020–2025 and get a Sharpe of 2.1. You then test the optimized parameters on data from 2019 (which the optimizer never saw) and get a Sharpe of 0.4. What does this tell you?
What's Next
Your strategy has been tested. Now it's time to deploy it.
At this point, you know what your strategy is made of. You have indicators, conditions, and actions. You've backtested it honestly on data the optimizer never saw. You know its Sharpe ratio, its Sortino, its max drawdown, and exactly what kind of market conditions it was built for.
That's the difference between a strategy and a guess. Going live with a guess is how people lose money. Going live with a tested, understood, well-scoped strategy is how you trade with confidence.
Module 6 is about making that transition without rushing it. Paper trading first. Broker connection. Execution schedule. A pre-deployment checklist that forces you to answer the questions most traders skip. By the end, you'll know exactly when your strategy is ready to run with real money, and when it isn't.
NexusTrade's backtesting engine runs your strategy against years of historical data in seconds. Aurora can help you interpret the results and optimize your parameters.
Get 3 Months Premium Free — via Public.comOpen a Public.com brokerage account, connect it to NexusTrade, and get 3 months of Premium free. · Or take the full course →
No comments yet.