The Chinese OBLITERATED OpenAI. A side-by-side comparison of DeepSeek R1 vs OpenAI O1 for Finance
Before today, I thought the OpenAI O1 model was the best thing to happen to the field of AI since ChatGPT.
The O1 family of models are “reasoning models” — instead of the traditional model which responds instantly, these models take their time “thinking”, resulting in much better outcomes.
And MUCH higher prices.

In fact, these models are so expensive, that only the premium users for my AI app had access. Not because I didn’t want to inhibit my users, but because I quite literally could not afford to subsidize this expensive model.

However, thanks to the Chinese, my users can now experience the full power of the next-generation of language models.
And they can do it at 2% of the price. This is not a joke.
The Chinese ChatGPT – like OpenAI and Meta had a baby
DeepSeek is the Chinese OpenAI, with a few important caveats. Unlike OpenAI, DeepSeek releases all of their models to the open-source community. This includes their code, architecture, and even model-weights — all available for anybody to download.
Ironically, this makes them more open than OpenAI.
DeepSeek R1 is their latest model. Just like OpenAI’s O1, R1 is a reasoning model, capable of thinking about the question before giving an answer.
And just like OpenAI, this “thinking process” is mind-blowing.
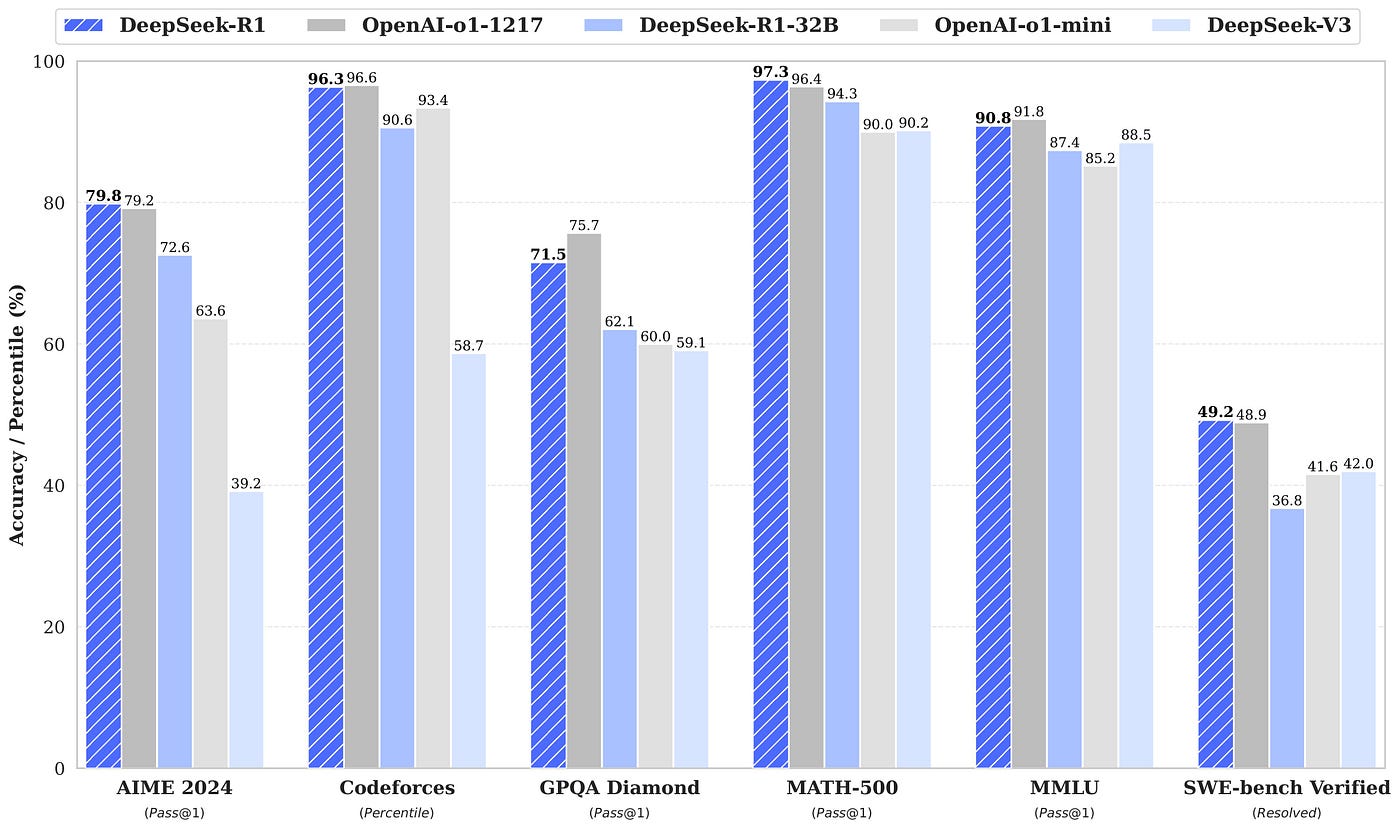
R1 matches or surpasses O1 in a variety of different benchmarks. To look at these benchmarks, check out their GitHub page. Additionally, from my experience, it’s faster, cheaper, and has comparable accuracy.
In fact, if you compare it apples-to-apples, R1 isn’t just a little cheaper; it’s MUCH cheaper.
- R1: $0.55/M input tokens | $2.19/M output tokens
- O1: $15.00/M input tokens | $60.00/M output tokens

At the same benchmark performance, this model is 50x cheaper than OpenAI’s O1 model. That’s insane.
But that’s just benchmarks. Does the R1 model actually perform well for complex real-world tasks?
Spoiler alert: yes it does.
A side-by-side comparison of R1 to O1
In a previous article, I compared OpenAI’s O1 model to Anthropic’s Claude 3.5 Sonnet. In that article, I showed that O1 dominates Claude, and is capable of performing complex real-world tasks such as generating SQL queries. In contrast, Claude struggled.
The SQL that is generated by the model is subsequently executed, and then the results are sent back to the model for further processing and summarization.

I decided to replicate this same exact test with O1. Specifically, I asked the following questions:
- Since Jan 1st 2000, how many times has SPY fallen 5% in a 7-day period?
- From each of these start dates, what was the average max drawdown within the next 180 days? What about the next 365 days?
- From each of these end dates, what was the average 180 day return and the average 365 day return, and how does it compare to the 7 day percent drop?
- Create a specific algorithmic trading strategy based on these results.
For a link to the exact conversation, where you can view, duplicate, and continue from where I left off, check out the following link.
Using R1 and O1 for complex financial analysis – a comparison
Let’s start with the first question, basically asking the model how often does SPY experience drastic falls.
The exact question was:
Since Jan 1st 2000, how many times has SPY fallen 5% in a 7-day period? In other words, at time t, how many times has the percent return at time (t + 7 days) been -5% or more.
Note, I’m asking 7 calendar days, not 7 trading days.
In the results, include the data ranges of these drops and show the percent return. Also, format these results in a markdown table.
Here was its response.

Let’s compare that to OpenAI’s o1’s response.

Both responses include a SQL query that we can inspect.

We can inspect the exact queries by viewing the full conversations and clicking the info icon at the bottom of the message.
If we look closely, we notice that both models responses are 100% correct.
The difference between them are:
- O1's response includes a total occurences field, which is technically more correct (I did ask “how many times has this happened?”)
- O1's response was also not truncated. In contrast, R1’s response was abridged for the markdown table, making it hard to see the full list of returns
OpenAI’s response was a little bit better, but not by much. Both models answered accurately, and R1’s response was completely fine in terms of extracting real-world insights.
Let’s move on to the next question.
From this, what is the average 180 day max drawdown, the average 365 day max drawdown, and how does it compare to the 7 day percent drop?
The R1 model responded as follows:

In contrast, this is what O1 responded.

In this example, R1’s answer was actually better! It answered the question of “how does it compare to the 7-day drop” by including a ratio in the response.
Other than that, the answers were nearly exactly the same.
For the next question, we asked the following:
What was the average 180 day return and the average 365 day return, and how does it compare to the 7 day percent drop?


In this case, the results were almost exactly alike. The formatting for R1 was slightly better, but that’s completely subjective.
The real test is seeing if R1 can excel in a completely different task – creating automated trading strategies.
Using R1 and O1 for creating algorithmic trading strategies
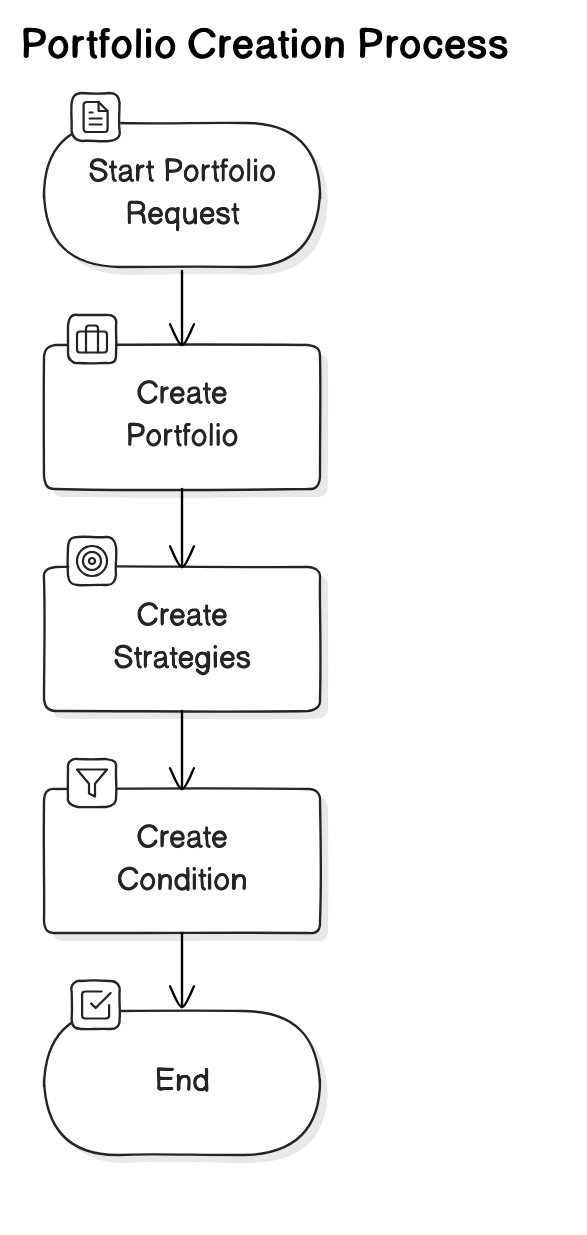
To create a trading strategy, we’re essentially asking the model to generate a configuration for a “portfolio”.
Creating this configuration involves many steps.
- We create the “portfolio”, which includes a name, an initial value, and a description of the trading strategies.
- From this description, we create “strategy” configurations. This configuration includes an action and a description for when the action should be executed (called a “condition”).
- From this description, we create the “condition” configuration, which can be interpreted for algorithmic trading
This process where the output of one prompt is used as the input of another prompt is called “Prompt Chaining”.
How this looks is as follows… we simply ask the following question to the model:
Create a portfolio with $10,000 with the following strategies
- Buy 50% of our buying power in SPXL if we have less than $500 of SPXL positions
- Sell 20% of our portfolio value in SPXL if we haven’t sold SPXL in 10000 days and our SPXL positions are up 10% or more
- Sell 20% of our portfolio value in SPXL if the SPXL stock price is up 10% from when we last sold it
- Buy 40% of our buying power in SPXL if our SPXL positions are down 12% or more
Just like O1, the model responds correctly, generating a highly profitable algorithmic trading strategy on its first try.
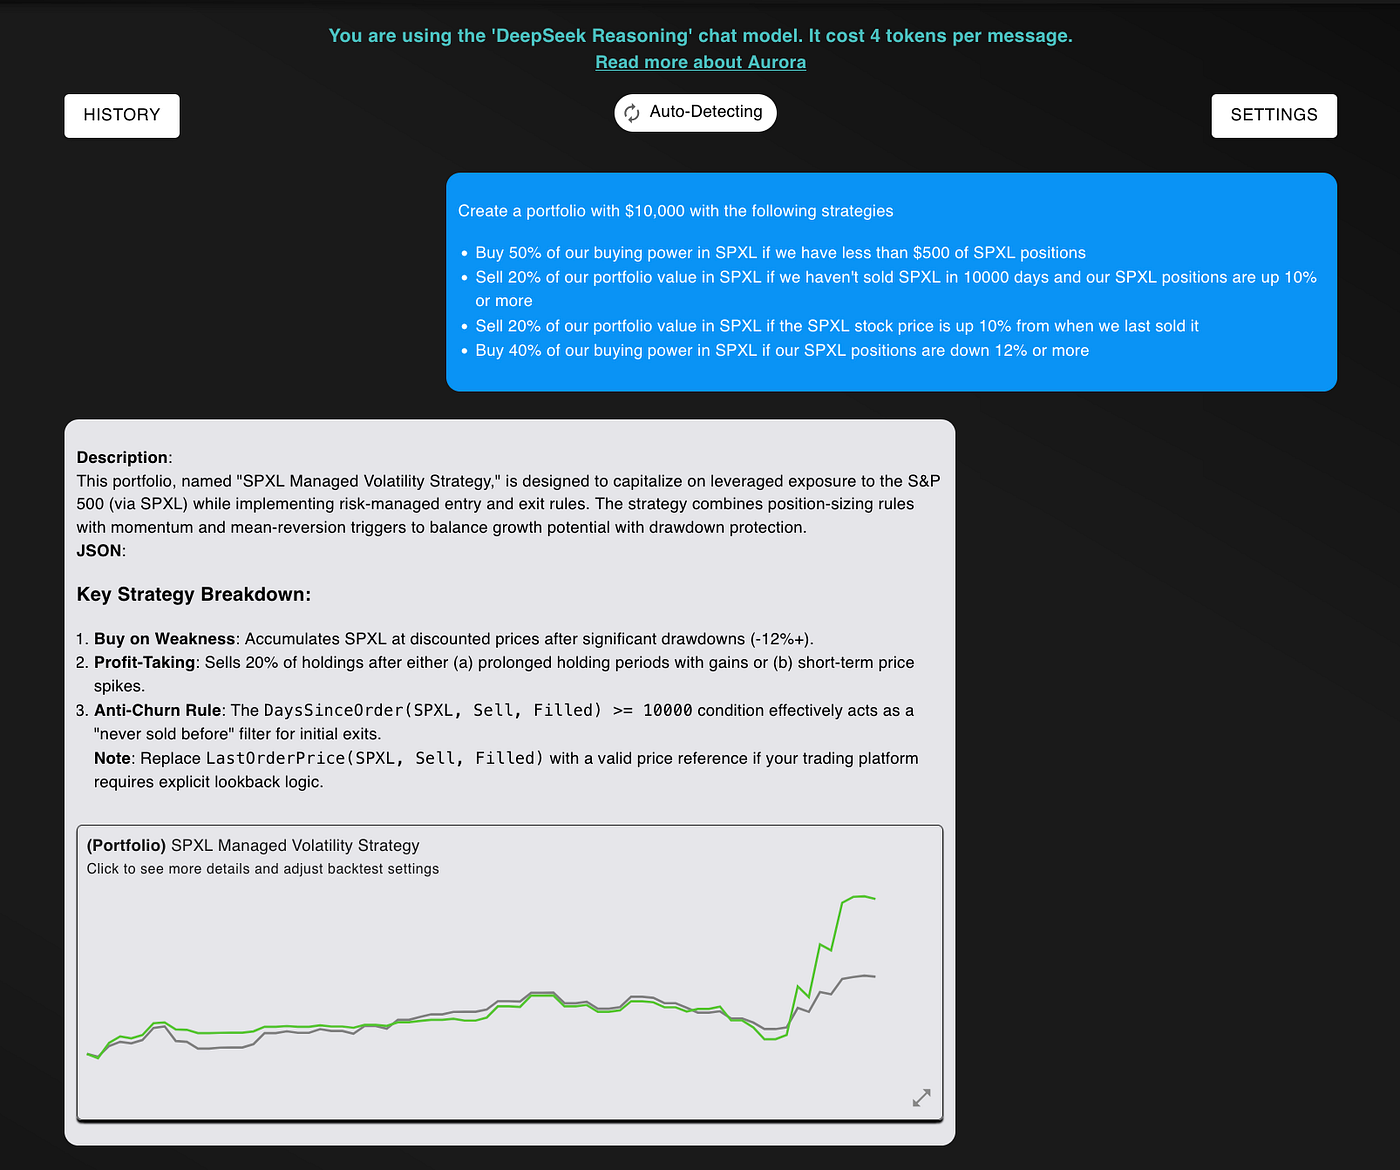
Compared to the S&P 500, this strategy is phenomenal. It outperforms the market by 2x, has a much higher sharpe ratio, a higher sortino ratio, and a similar maximum drawdown.

Absolutely incredible.
Caveats of this analysis: this model is NOT perfect
Despite being able to perfectly generate accurate queries and JSON configurations, the model does have some downsides.
To start, when viewing the logs of this model, I noticed that it would sometimes generate invalid SQL queries.

However, because my platform has self-correcting logic, where it will automatically retry queries that don’t make sense or are invalid, this was not a big problem, as it tended to rectify itself.
In addition to this, on one occasion, the model did timeout, giving no valid response to a question that I asked.

I had to re-ask the question, and it answered it correctly the second time.
I’m not saying other models (like O1) don’t have these problems; I just hadn’t noticed them. But at 2% the price, you can literally send 50x more messages with R1 to get comparable answers.
Because of this, these minor bugs don’t bother me one bit. The value this model unlocks is mind-blowing, and it makes powerful AI more accessible to everybody. With this model, my ChatGPT Pro subscription, standing tall at $200/month, almost seems like a waste of money. And that’s saying something.
Concluding Thoughts
With OpenAI’s reasoning model, it wasn’t love at first sight. I found it to be ungodly slow and very expensive. I only fell in-love with it when I started using it and saw how amazing it was for financial analysis and algorithmic trading.
With DeepSeek’s R1, I quite literally fell in-love instantly. This phrase is overused, but in this case, it is truly revolutionary.
Because they’re open-source, they have now empowered millions of developers to build on top of, modify, and improve their models, which will further drive down cost and force OpenAI to bring something massive.
And because they’re so cheap, I can enable the model for ALL users of my algorithmic trading platform, regardless if you’re a paying user or not.
In fact, the model is so cheap and so powerful, that I switched the default model for all users to it. With it only being 4 times more expensive than OpenAI’s 4o-mini (their most inexpensive model and my previous default model), I literally saw no reason not to.
With this model, AI has just become accessible to everybody. OpenAI, Anthropic, and Google are in a lot of trouble. If a much smaller, open-source model trained on cheaper GPUs can outperform these multi-billion (or trillion) dollar tech giants, there’s absolutely no way they’ll survive without a “Mirror Force” like trap card in their sleeve.
And the entire world will benefit from their demise.
Thank you for reading! To see the full power of DeepSeek’s R1 for financial analysis and algorithmic trading, create a free NexusTrade account today!
Follow me: LinkedIn | X (Twitter) | TikTok | Instagram | Newsletter
|
Aurora's Insights Subscribe to Aurora's InsightsStay ahead of the market with AI-powered analysis. No spam. Unsubscribe anytime. By subscribing, you agree to our Privacy Policy. You're subscribed!Finish creating your account to backtest strategies, deploy to live markets, and access every article. |
Is OpenAI done for or will O3 give them a lifeline? Share your thoughts!