I used AI to analyze every single US stock. Here’s how you can use it to make data-driven investing decisions
In a previous article, I described how I used AI to analyze every single US stock.
At a high-level, I took the fundamentals of each stock (provided by a high-quality data provider, EODHD), computed some metrics like CAGR and YoY growth, and supplied this information to a large language model.
The end result was a detailed analysis for every single US stock.
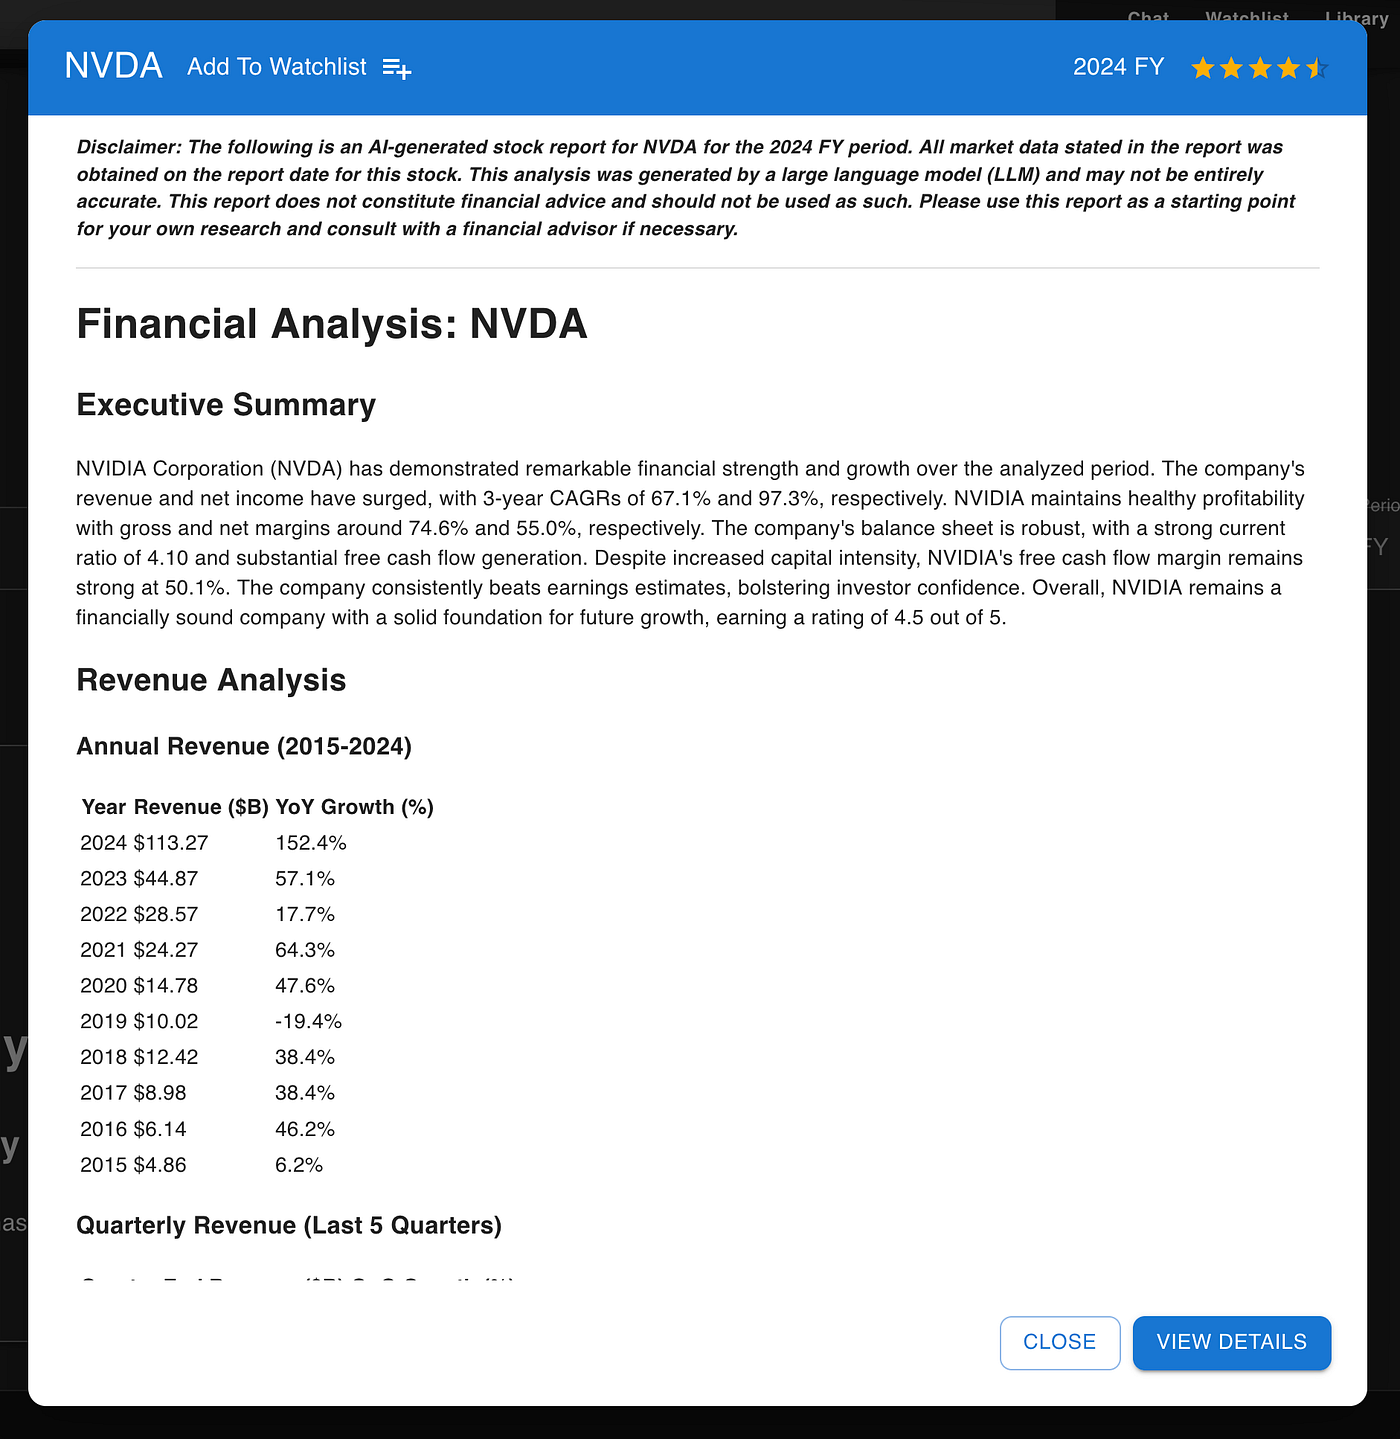
This analysis is extremely useful, especially because I’ve integrated the results into the NexusTrade AI, allowing you to find fundamentally strong stocks using natural language.
But, most retail investors don’t have a clue on how to make use of this comprehensive analysis.
This article will show you how.
Turning financial analysis into an investment thesis
You can use this list of stocks to find stock trends that hold over time. Here’s how.
Let’s say you wanna test how if fundamentally strong stocks with a low P/E ratio had good forward-looking returns.
To test this idea:
- You can fetch a list of stocks with a high rating and low P/E ratio in the past
- You can backtest these stocks for the following year
- You can repeat this for as many years as you want
To test this, I’m going to fetch stocks in 2021 and see how well it performs in 2022. And, I will repeat this for 2022 to 2023.
However, for a comprehensive analysis, you should do this for at least 5–10 years of data. For the sake of brevity, I won’t do this in this article, but you can do it yourself here.
Additionally, if you want to read the full analysis, you can do so by clicking my “shared conversation” link.
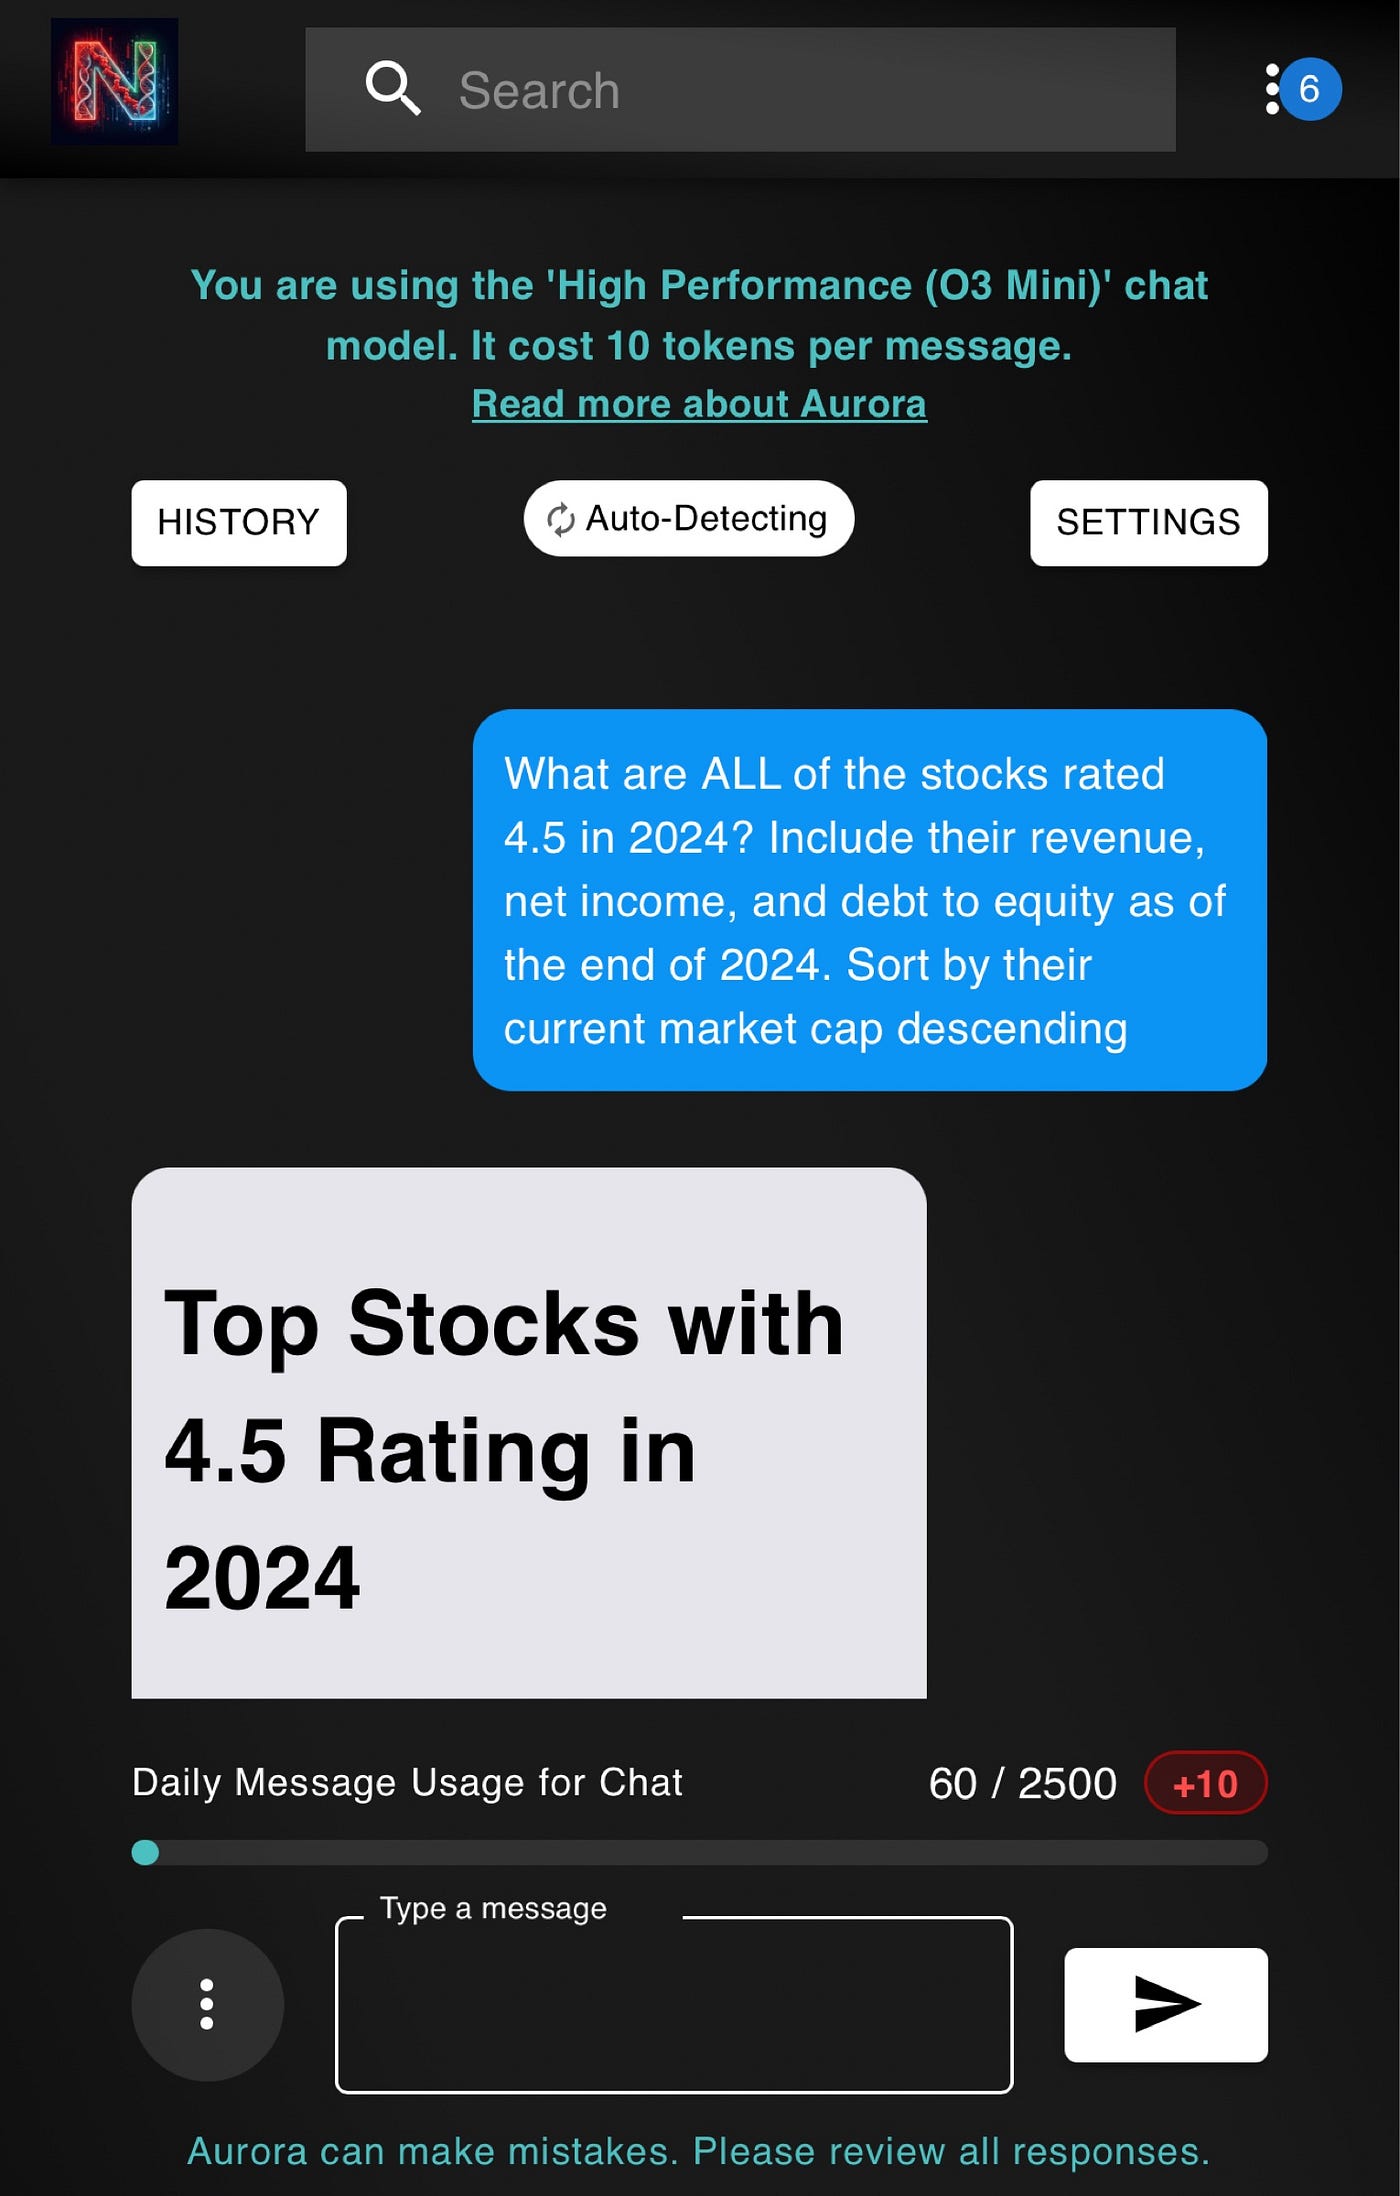
To start this analysis, I asked the AI the following:
In 2021, what were the most fundamentally strong stocks that had a positive P/E ratio less than 15?
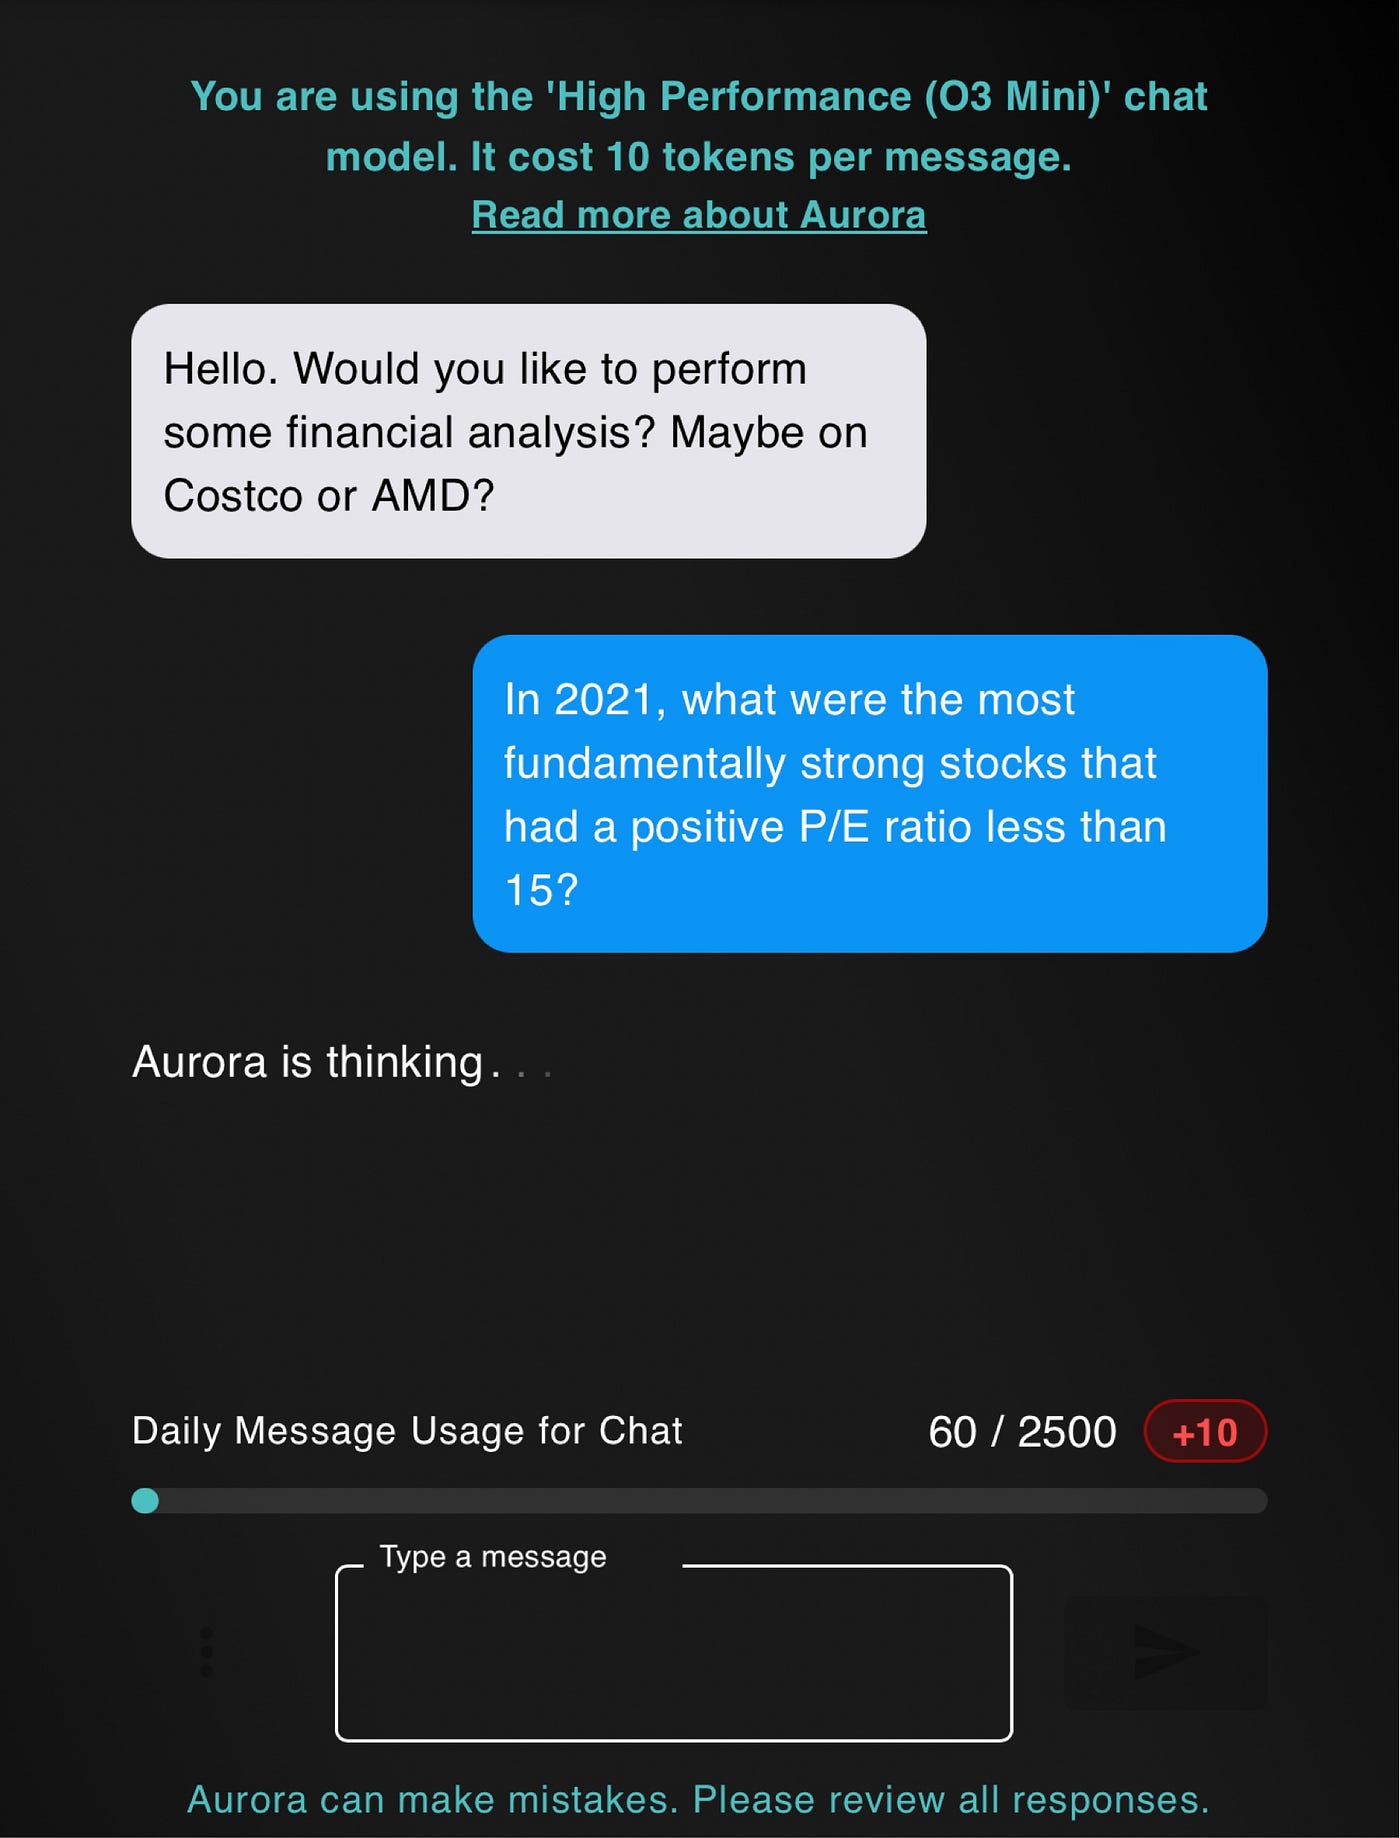
After a few seconds, we get this list of stocks.
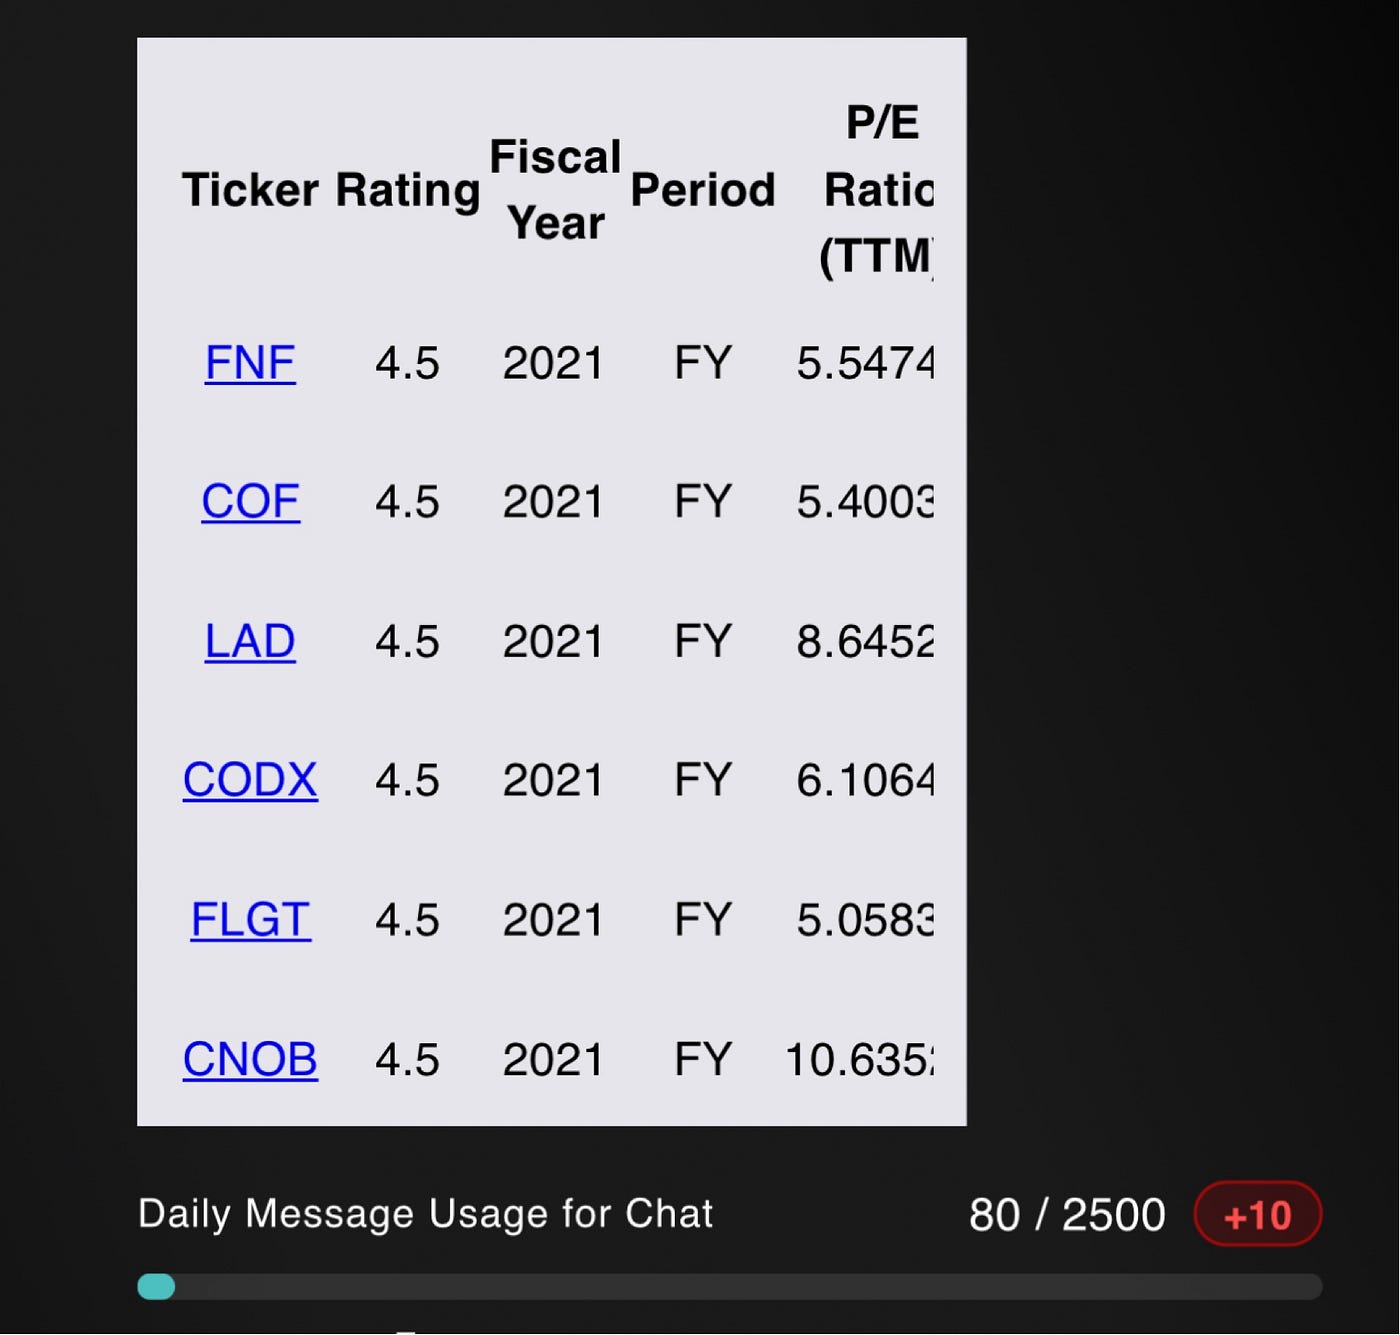
I then had a back and forth conversation to finally filter the list of stocks to only include stocks with a rating of 4.5 and a positive P/E ratio of less than 15.
I then used the AI to create a trading strategy.
Create a strategy to buy and hold this list of stocks
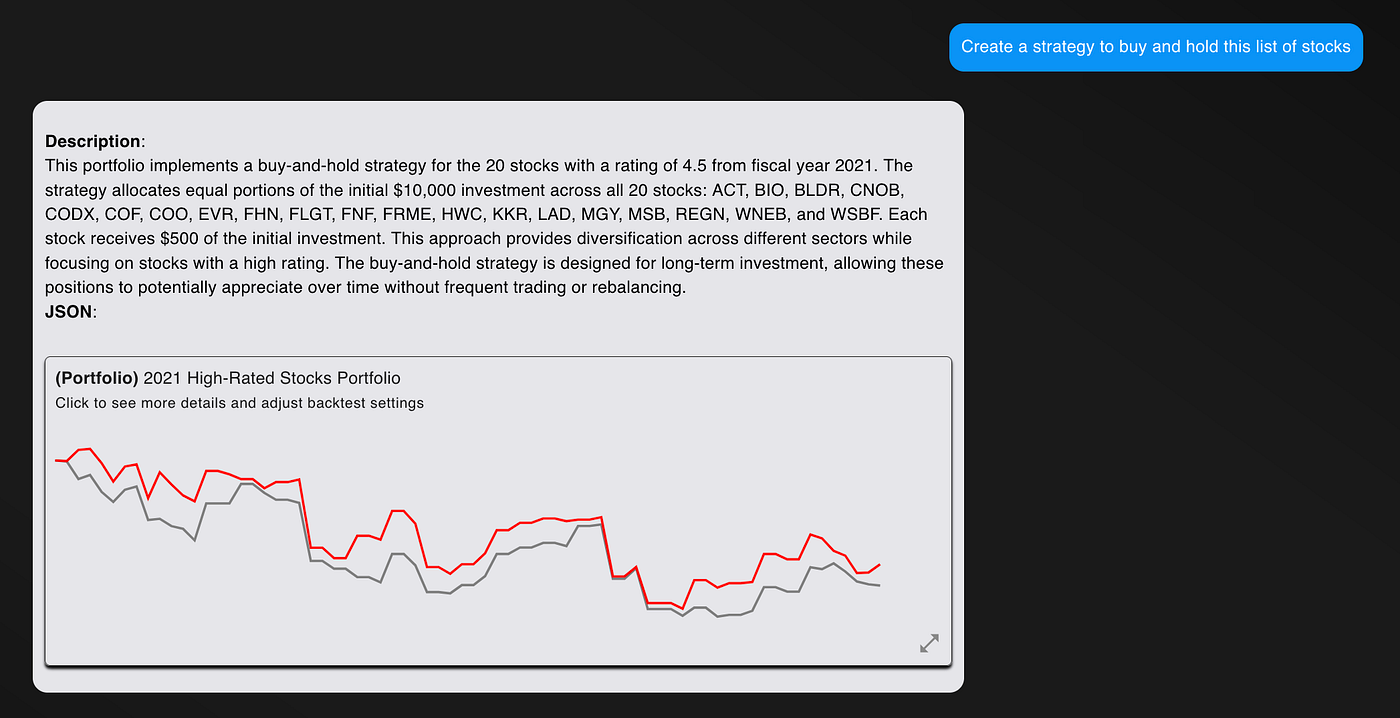
In this example, we see that this list of stocks with a low P/E ratio barely beat the market (to a negligible degree). Let’s repeat this exact thing for 2022.
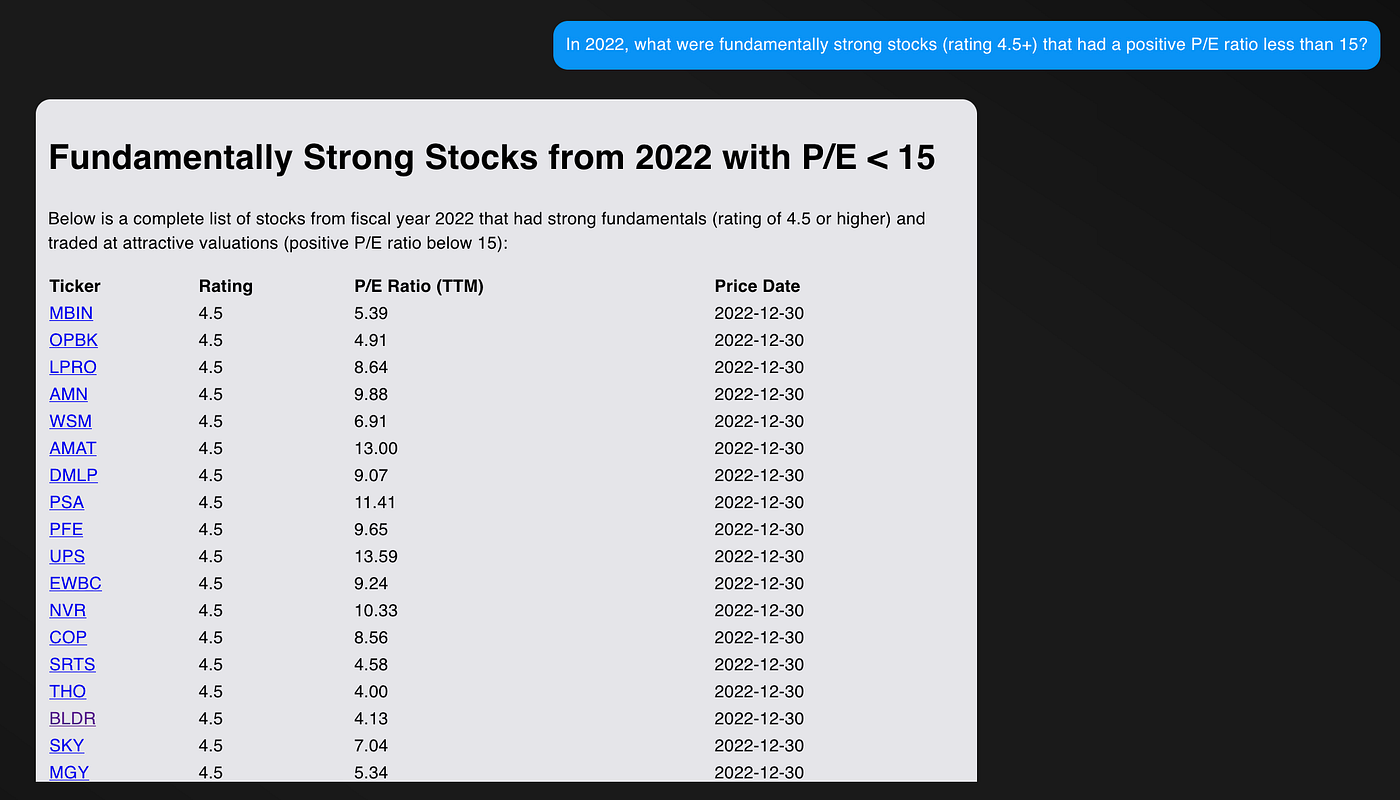
In 2022, what were fundamentally strong stocks (rating 4.5+) that had a positive P/E ratio less than 15?
We get the following list of stocks.
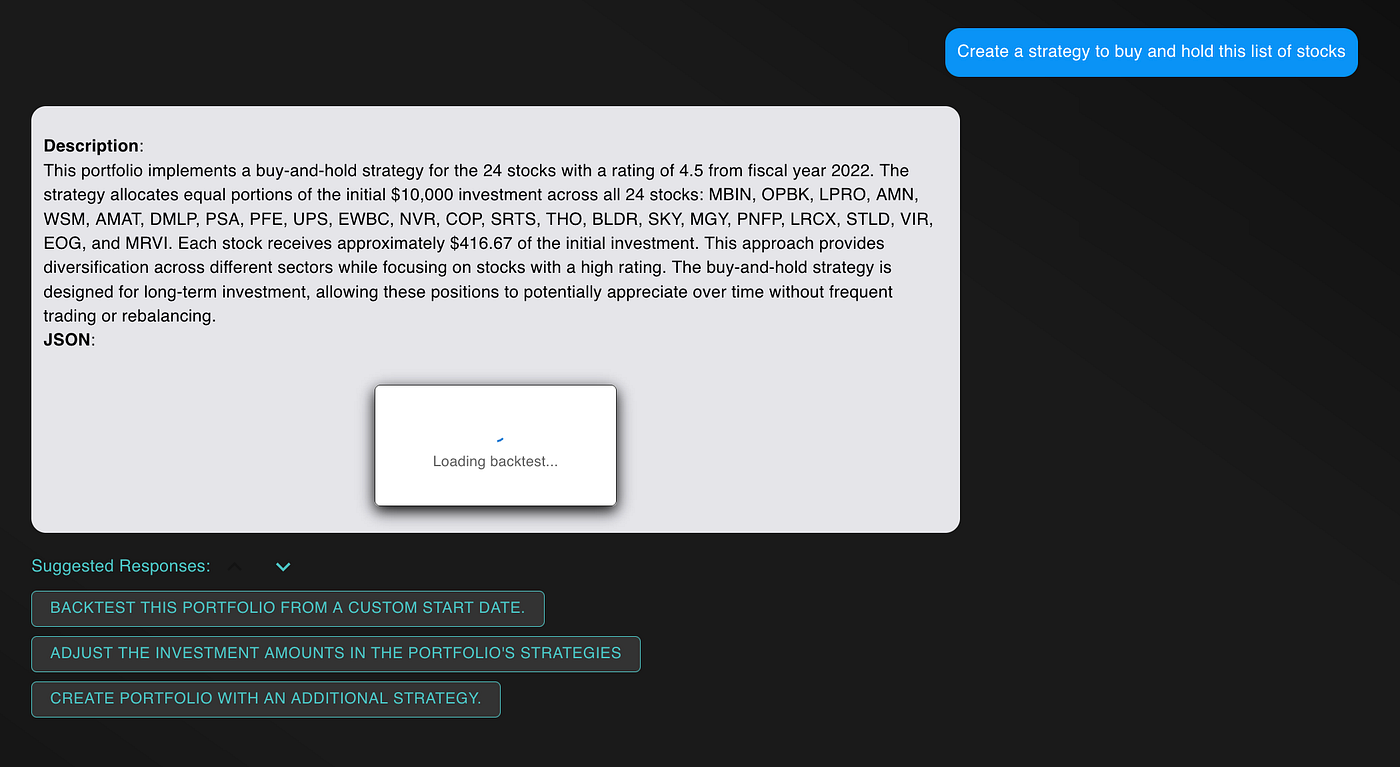
Then, like before, we can create another trading strategy.
Create a strategy to buy and hold this list of stocks
From here, we can either update the backtest settings manually.
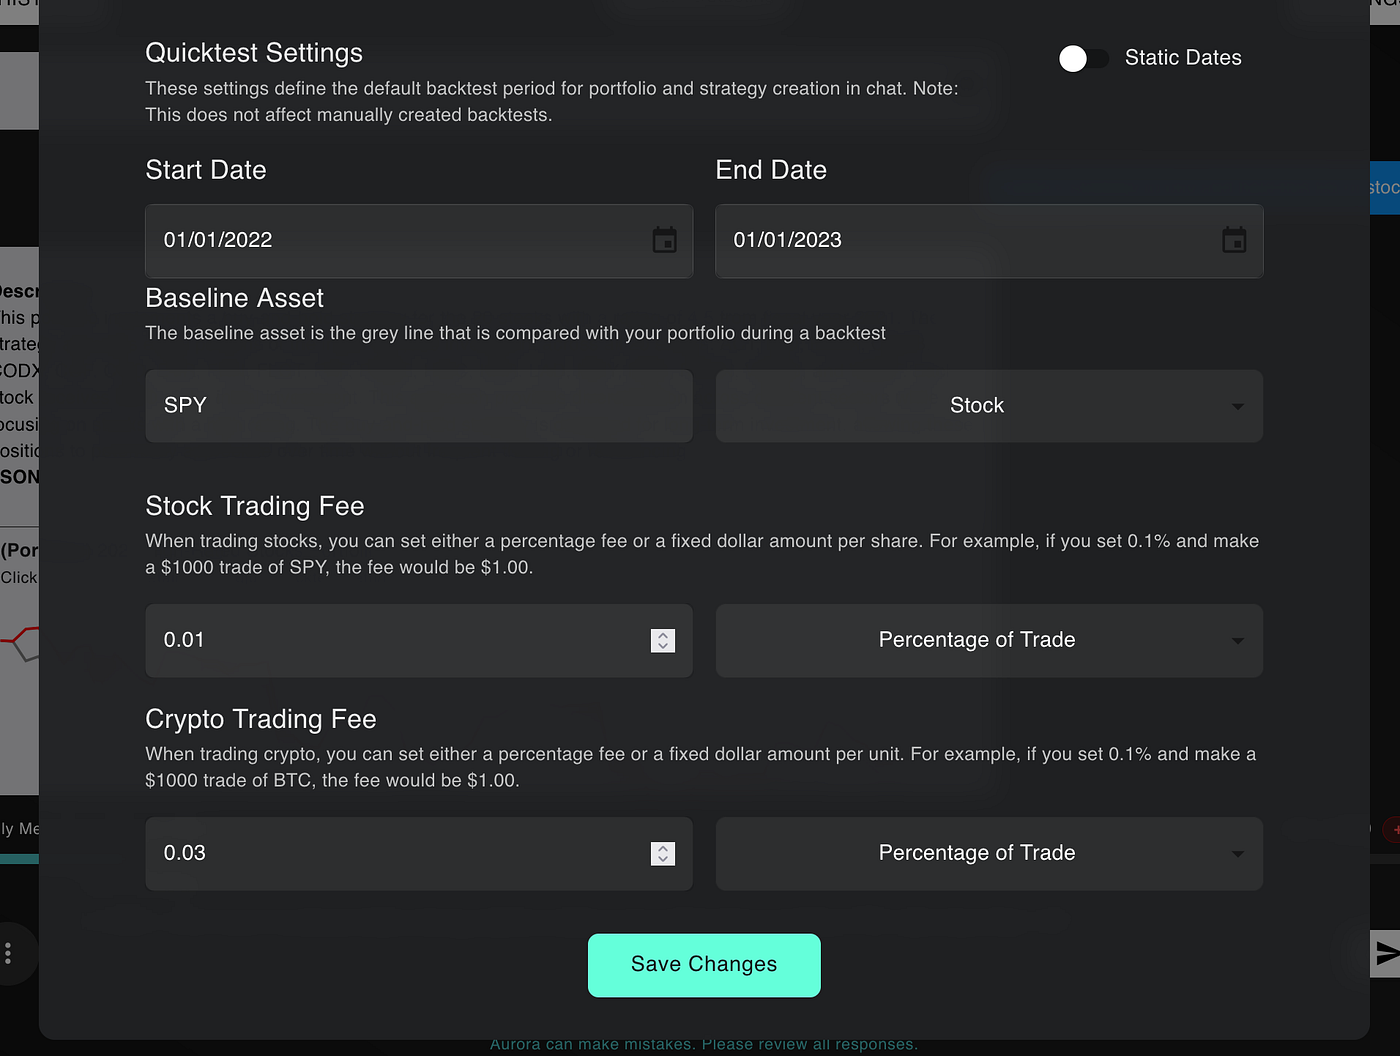
Or, we can launch the backtest by typing in the chat the exact period we want to simulate.
backtest this portfolio from Jan 1st 2023 to Jan 1st 2024
Regardless, you’ll get the following result.
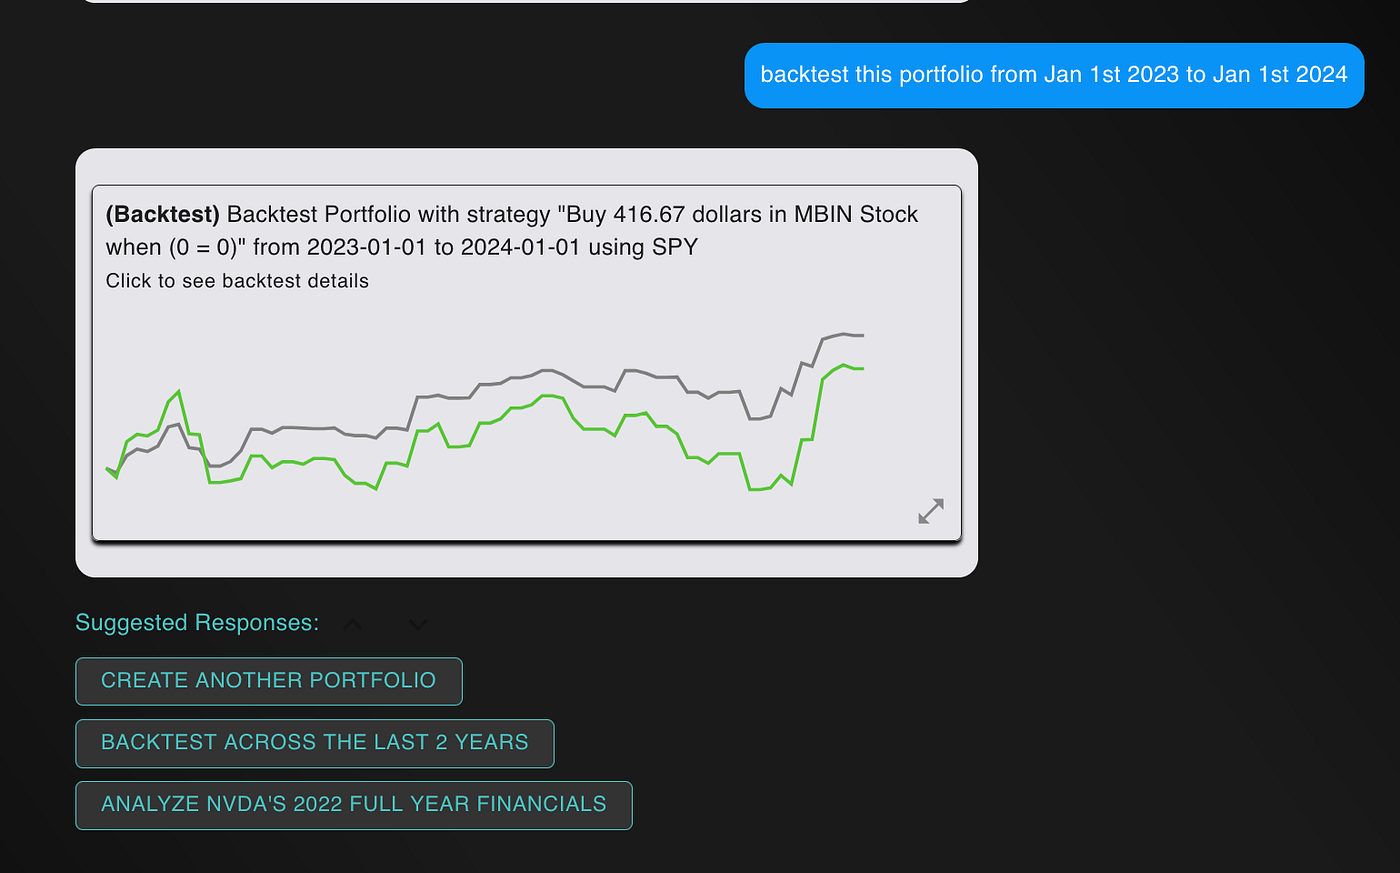
In this example, the S&P500 outperformed our list of stocks with low P/E ratios. This suggests that trying to buy “fundamentally strong” stocks with a low P/E ratio may not be a better idea than buying SPY.
This analysis is very informative. If your buddy comes to you next week and says “you should buy this stock; it has a low P/E ratio!”, you now have the practical experience to understand that P/E ratio alone is NOT a convincing argument to buy a certain stock.
And yet, even this analysis is incomplete. We can do better.
How to iterate on this analysis?
This analysis just showed ONE possible test. The results of this analysis were lackluster, but how could we do better?
I’ll leave this as homework for the curious reader. Some ideas include:
- What if we sorted by quarterly P/E ratio instead of TTM P/E ratio?
- What if we used P/B ratio?
- What if we chose the 5 lowest stocks by P/E ratio instead of the full list?
- What if we used market cap instead of P/E ratio?
- What if we did 3-year compound annual growth rate (CAGR) instead of P/E ratio?
- What if we filtered the range for stocks to be stocks with a P/E ratio between 15 and 25?
- What if we started backtesting in 2019? Or tested the robustness in 2025 (so far)?
- Better yet, what if we see if this strategy performs well in bear markets vs in bull markets?
Because of NexusTrade, we can test different trading strategies using pure natural language. We can test different technical and fundamental indicators, and gain insights into how they actually performed.
But I’m not going to do the work for you. I want you to try it out for yourself. Go crazy! Use different strategies (like SMA crossover, Bollinger Bands, or Relative Strength Index). Use complex conditions or different fundamental indicators. And use your creativity to create a profitable trading strategy.
And once you get a strategy that weathers the Covid storm and flies during the massive bull run, you’ll know you’re ready to take your trading strategy and either paper-trade it, or deploy it with small amounts of money.
Algorithmic trading isn’t easy. But for the first time ever, it’s accessible to everybody. Do you want to sit on the sidelines? Or do you want to sit down and create a profitable trading strategy based on real analysis and data?
If you made it this far, then I know exactly which option you’ll choose.
And I can’t wait to hear about what you created in the comme
No comments yet.