Don’t Be an Idiot and Sell NVIDIA Because of DeepSeek. You Will Regret It
If you haven’t been living under a rock this weekend, you know that China shocked the AI world with its unveiling of DeepSeek R1.
DeepSeek R1 is quite literally the best open-source model the world has ever seen. It has performance comparable to OpenAI’s best model, O1, at just 1/50th the cost. Because of this, some people believe this spells the end of the “AI Tech Rally.” They argue that stocks like NVIDIA, which benefit massively from a monopoly on GPUs, will see their run end and that the U.S. stock market is headed for a cataclysmic crash.
These people are wrong.
DeepSeek and the U.S. Tech Market
Now, the connection between DeepSeek and the Tech Market may not be clear for people that aren’t well-versed in stocks. Let me break this down.
DeepSeek R1 is a model developed by a small team in China. To train the model, it costs them $5.6 million. In comparison, models like llama, O1, and Mistral cost billions of dollars to train.
To add insult to injury, DeepSeek is entirely open-source.
This sent US tech stocks into a panic. If a small team of scientists can train a better model than the best US model at a fraction of the cost, why are we wasting hundreds of billions of dollars training these large models?
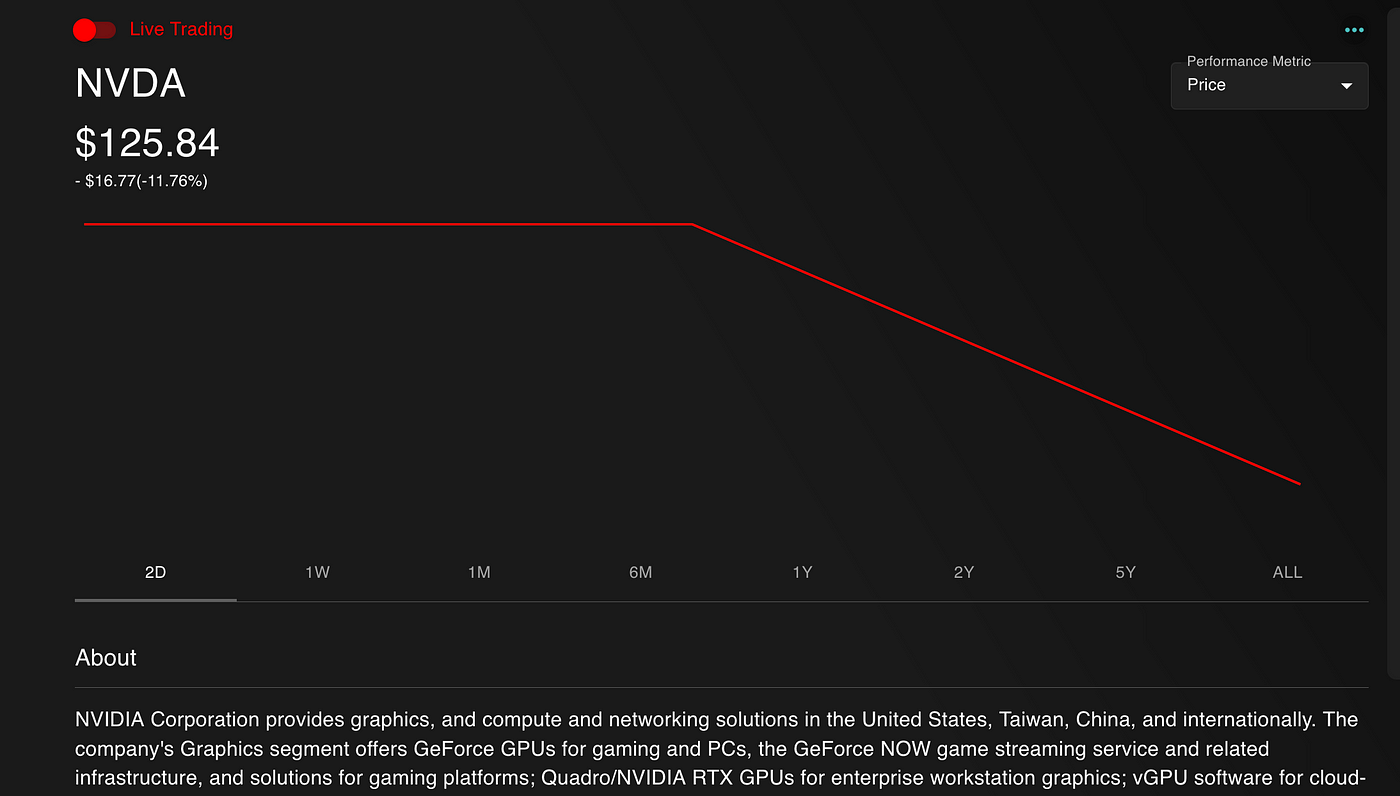
More specifically, NVIDIA’s stock was decimated today, losing over 12% overnight.
A Deeper Dive Into NVIDIA
DeepSeek poses a potential threat to NVIDIA’s entire business. If a company can train a state-of-the-art model using inexpensive GPUs, why spend hundreds of thousands of dollars on the “good ones”?
These fears, however, are overblown. In fact, I dare say this is good news for NVIDIA. The ability to train better models on cheaper hardware implies that we can train even more powerful models on high-end hardware.
Take for example, OpenAI’s Operator, their agentic framework.
In a previous article, I explained why Operator is too slow and too “dumb” to be used for serious agentic work.
If we can cheaply build state-of-the-art models on low-cost hardware, it becomes realistic for companies to build robust AI agents on the top-tier GPUs that NVIDIA offers.
In fact, this development will accelerate innovation. We now have a blueprint for creating compute-efficient large language models. Who benefits more than the company selling the “shovels,” i.e., high-performance GPUs?
Still, that’s my opinion. Let’s look at some cold, hard facts about NVIDIA.
Using AI to Analyze NVIDIA Price Movement
I’m using NexusTrade, an AI-Powered financial analysis tool, to analyze past NVIDIA’s past price movements.
I’m going to ask the following questions:
- How many times has NVIDIA fallen 10% overnight?
- From the start date of that drop, what was the maximum drawdown
- From that same start date, what was the average return 6 months later, and what was the average return 12 months later?
Important Note:
This analysis only shows us how NVIDIA has behaved historically. It does NOT predict future performance. Past performance does not guarantee future returns. Use this as an educational reference, not as financial advice.
With that said, let’s analyze NVIDIA. If you want to read the full analysis for yourself, check it out here.
How Many Times Has NVIDIA Fallen 10% Overnight?
Because accuracy for this analysis is critical, I’m going to switch to the OpenAI O1 model for this analysis by clicking “Settings”.

I’m then going to ask the AI the following question.
Since NVIDIA’s inception, how many times has it fall 10% or more in overnight? Look at the close price on day x and the open price on day x+1. Then give me the total number of trading days. Finally, give me the ratio
To answer this question, the AI is going to analyze all of NVIDIA’s price history and tell me how many times NVIDIA has fallen 10% overnight.
After about a minute, the AI found that this has happened 22 out of 6,307 times.

This tell us that drastic drops like this are extremely rare, which might indicate a potential buying opportunity if you believe in NVIDIA long-term.
Let’s dive deeper.
What Is the Maximum Drawdown for an Overnight Fall?
Next, I want to figure out what is the maximum drawdown of a dramatic overnight fall for NVIDIA. I could ask in one of two ways:
- What is the drawdown from the start date?
- What is the drawdown from the end date?
In this analysis, I want to figure out the total pain from holding NVIDIA from the beginning of the fall, although one can easily ask the AI from the end as well. Here’s what I asked.
At the beginning of each 10%+ drop, what was the maximum drawdown?
It outputted a rather large table with each data point in NVIDIA’s history.

I then asked the model to compute the average maximum drawdown, and this was the result.

We see that from peak to trough, NVIDIA’s maximum drawdown on average of 34%. This is a rather steep fall, and can make even the hardest of hands sweat with fear and anxiety.
But it’s not all bad.
What Was the Average Return 6 Months and 12 Months Later?
Finally, I asked the model to show how NVIDIA performed 6 months and 12 months after each 10% overnight drop:
At the beginning of each 10%+ drop, what was the return 6 months later and what was the return 12 months later?
Again, the model outputted a large table with the returns 6 months later and 12 months later.

I again asked the model to summarize everything. Here was the final result.

After processing the data, this analysis showed:
- While investors could face an average 34% drop,
- They also saw an average 41% return from the drop’s start date over time.
In other words, if you’re bullish on NVIDIA, these historical trends suggest that a sudden fall might be a buying opportunity. Numbers don’t lie — assuming, of course, you still have faith in the company’s fundamentals.
Here’s why I still do.
Using AI to analyze NVIDIA fundamentals
Next, I want to show how to use AI to analyze NVIDIA’s fundamentals. Specifically, I want to ask two questions:
- Analyze NVIDIA’s last 4 years of earnings
- Analyze NVIDIA’s last 4 quarters of earnings
This time, I’ll switch to a more inexpensive, but still capable model, Claude 3.5 Sonnet.

Again, if you want to see the full analysis for yourself, you can read it here.
Now, let’s start with the multi-year analysis.
Multi-Year Analysis
Look at NVIDIA’s earnings for the past 4 years. Specifically, look at its revenue growth, net income growth, EPS growth, and other important evaluation metrics. Then give NVIDIA’s fundamentals a rating from 1 to 5.
This was the result.

At the end of the response, the model gives NVIDIA a rating from 1 to 5. It will also explain why it gave that rating.

In the end, Claude gave NVIDIA a 5/5 rating; quite literally a perfect score.
Let’s repeat the analysis for the past 4 quarters.
Recent Quarters
Look at NVIDIA’s earnings for the past 4 quarters. Specifically, look at its revenue growth, net income growth, EPS growth, and other important evaluation metrics. Then give NVIDIA’s fundamentals a rating from 1 to 5.
It again gave the following results.

If we scroll down, we see again that NVIDIA is a perfect 5/5.

Such a rating for a model is exceptionally rare. But the question is, should you trust the analysis?
Why I trust AI analysis?
Now, I am not qualified to give financial advice; I can only state my opinion, and why I have been trusting financial analysis more and more as time goes on.
For one, the AI is getting its answers backed by data. We’re not just asking ChatGPT about its “opinions” based on its training data – we’re litterally fetching real-time financial data and asking the AI to perform an objective analysis. I’ve written more about how this works here.
Additionally, according to the research, there is strong evidence to suggest that LLMs are better at performing financial analysis than professional financial analysts. I’ve broken this down in-detail in the following video.
Overall, the bottom-line is that you should perform research for yourself. Because of my personal experience working with AI, I’m as bullish on NVIDIA as I’ve ever been. I’m holding this stock for the long-term. Are you?
Concluding Thoughts
The DeepSeek R1 model has sent a rapture through the AI world. Because R1 can be trained on cheaper hardware, many people see this as a bad omen for NVIDIA’s dominance.
I disagree.
This development could spur even more AI innovation as it becomes easier for more teams to train advanced models. Furthermore, based on the historical price and fundamental analysis, I see evidence to suggest that this market reaction is overblown.
More specifically, from this analysis:
- We know the max drawdown from the start of a 10%+ drop to the bottom is 34%
- We know the average return from the start of a 10% drop 6 months later is 42%
- We know the average return from the start of a 10% drop 12 months later is 57%
- Based on the last 4 years and the past 4 quarters, NVIDIA is rated a 5/5 based on its fundamental growth
No one can say with certainty how DeepSeek will affect NVIDIA’s long-term position as a tech leader, but NVIDIA’s hardware, software ecosystem (Cuda), and market dominance aren’t likely to fade anytime soon.
To perform this detailed analysis, I used NexusTrade, my AI-powered financial analysis tool. With it, anyone — even non-technical users — can conduct in-depth financial research using real data. I invite you to check it out and see how a data-driven approach might transform your portfolio. It’s free.
Are you buying NVIDIA, selling NVIDIA, or holding?