If you’re not a highly technical nerd (like me) interested in implementing an automated trading system, then you might want to skip this article. I wrote it because my Technical Design Documents (TDDs) tend to vanish in the ether forever once I’ve finished implementing the new feature it describes. I think this is a sad fate for the documents that I spend so much time and effort on, and in the spirit of “Build in Public”, I’ve decided to write this TDD for the world to see! This article will be a glimpse of what runs through my mind all day when thinking about improving NexusTrade.
|
The purpose of this document is two-fold. For one, I legitimately need to make a document to gather my thoughts. This feature is not only complicated, but it is essential that I get right the first time in order to make NexusTrade truly differentiated amongst other platforms. Number two, I want to show the amount of complexity that's hidden under the hood for an average NexusTrade user. The users of my platform don't have to worry about any of this; they can simply use tools that are provided.
|
This implementation will catapult NexusTrade's functionality. It will allow the creation of fully automated trading strategies to a level that no other platform can compare. The value of this feature cannot be understated, and I'm excited to be detailing the implementation.
|
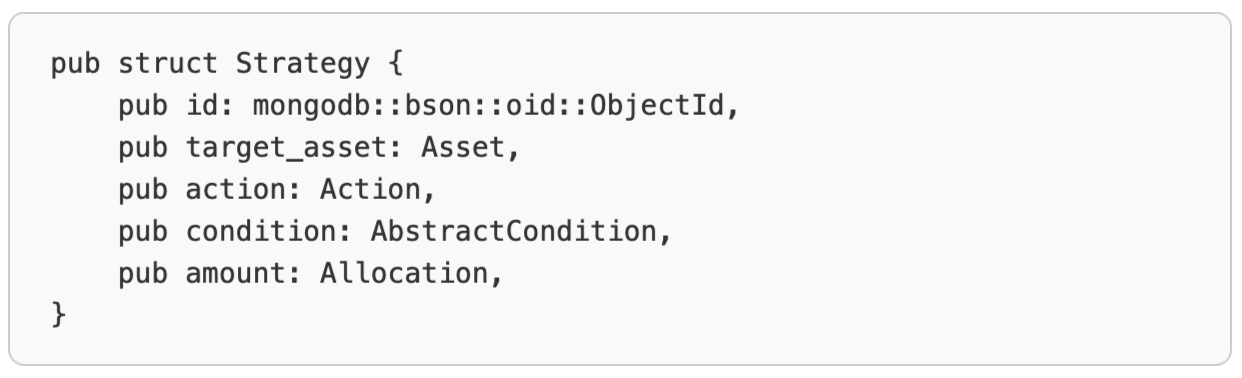
NexusTrade is an investing research platform that helps users learn how to approach the stock market. One of its core features is the ability to create, backtest, optimize, and deploy automated trading strategies. These strategies are rules for interacting with the stock market. They consist of a target asset, an amount of money, an action, and a condition.
|
The condition is broken down further, and the simplest type of condition is expressed as a comparison between two “indicators”. An “indicator” can be thought of as any number, but in trading, most commonly refers to values such as a stock’s price, a constant value, or other technical or fundamental indicators.
|
Before we continue, it’s important to make a distinction between technical indicator and fundamental indicator. In trading, a technical indicator is a calculation usually based on price or volume. For example the Simple Moving Average is a technical indicator. Fundamental indicators are metrics that represent key insights into a company’s strength, growth, and value. Revenue and net income are key fundamental indicators.
|
Presently, the NexusTrade platform only supports creating strategies with price-based technical indicators and indicators that can be calculated fairly trivially. However, theoretically, the architecture of NexusTrade has the flexibility to express any trading strategy. It’s time to finally put this theory to the test and implement fundamental indicators. This document will be a technical guide on how to accomplish this within the NexusTrade platform.
|
- Design an implementation strategy for ingesting and interpreting fundamental data at different frequencies
- Create an extensible solution that can incorporate arbitrary data types (for example, news sentiment)
- Ensure fundamental data indicators have the same level of configurability as the technical indicators including compound fundamental indicators (e.g., the Rate of Change of the Net Income)
|
- Detail a specific implementation plan for different types of fundamental indicators, including earnings indicators or sentiment analysis indicators
- Design a way to configure fundamental indicator strategies using the AI-Powered Chat or by implementing additional UI features. A separate document will focus on that
|
Thankfully, past projects have laid the groundwork for a successful and relatively straight-forward implementation. The key portions of this implementation are hydrating the fundamental data into the database, ingesting the data into the Rust app, incorporating the data into the backtesting and live-trading system, and doing so in a way so the system doesn’t suffer from lookahead bias.
|
When implementing the AI-Powered stock screener, we hydrated fundamental data from SimFin for every stock in the market. This includes:
|
Notably, there are different types of fundamental data and unlike price data, they have varying frequencies. For example, a company's PE ratio is updated everyday, but a company's revenue is updated once per quarter. Thus, this design document will be focused on ingesting all types of fundamental data from the database and incorporating it into the platform.
|
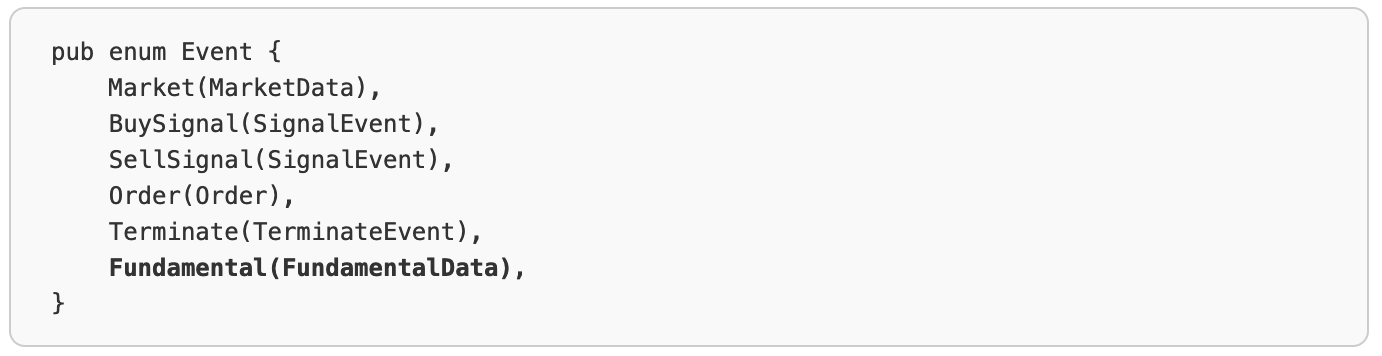
NexusTrade is designed with an event-driven architecture. Currently, “Market Data Events” are the type of events that trigger the automated trading strategies in NexusTrade. It signals that data was recently ingested and could potentially trigger one of our strategies. Working from this current implementation, we can either:
|
- Create a new Fundamental Data Event
- Extend the Market Data Events to include fundamental data attributes
|
Let’s discuss the pros and cons of each of these approaches.
|
Option 1: Creating a Fundamental Data Event
|
Creating a new Fundamental Data event is a viable option. It ensures low coupling between between Market Events and Fundamental Data events and achieves separation of concerns. After all, they are two fundamentally different concepts – market events occur throughout the day while fundamental data events occur at a much lower frequency.
|
Option 2: Extending Market Data Events
|
The other option is to extend the Market Data events and attach the fundamental data to it. While this does increase the coupling between two events, it doesn't make sense. For one, we won't have to implement an additional event handler; we could just re-use the existing architecture. Additionally, by coupling the two events, it would be trivial to create strategies that combine technical indicators with fundamental indicators. Let's say I wanted to do the Rate of Change of NVDA's price * the Rate of Change of NVDA's Income as an indicator. Coupling it introduces less challenges.
|
Final Verdict: Extending the Market Data Events
|
The implementation here is a lot easier, and the coupling actually makes sense. Creating a separate event would create its own challenges that I don't want to have to deal with.
|
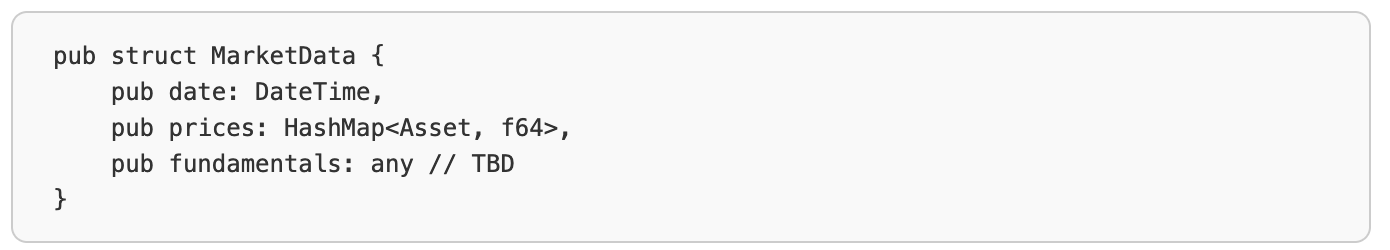
Populating our Market Data with Fundamental Data
|
Now that we've figured out what event to attach the fundamental data to, we have to populate this for both backtesting and livetrading. Here's what the updated MarketData struct will look like.
|
We can do this in our BacktestBrokerage. This struct is responsible for populating historical data for backtests and for calculating indicators that require this data such as the 7 day Simple Moving Average. This is what the current implementation looks like:
|
Populating the data in this function should be straightforward. We just have to:
- Query the fundamental data from the two different databases in my application
- Similar to the above snippet, populate an array of fundamental data
- Construct the MarketData Event (not shown above but trivial)
|
When implementing this solution, we'll use the publish date for earnings data. By choosing to do this, we completely eliminate the possibility of lookahead bias. At the same time, we'll make the data available the morning of the next trading day.
|
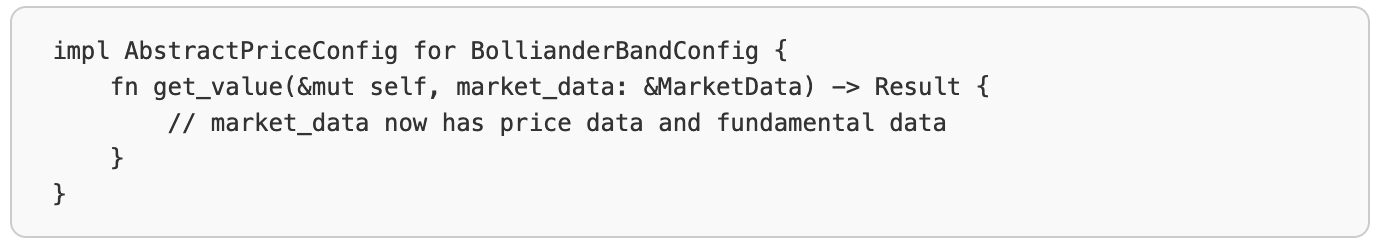
After populating the data in the BacktestBrokerage, the rest of the steps are more-or-less trivial. Because we chose to couple the fundamental data with the MarketData Event, we don't have to do any work implementing an additional event handler. Our strategies will get access to fundamental data, which can be used to make improved trading decisions, by incorporating logic to trade assets that have a good financial health (as defined by the user).
|
We also have to implement new indicators, but the discussion of such is out-of-scope for this document. After having the data available, implementing new fundamental indicators is again, fairly trivial, because we can follow the existing patterns within the platform. The great news is that we get the compound fundamental indicators for free! The current architecture of NexusTrade already fully supports this (thank you past Austin!).
|
I hope this document shows the amount of work required to implement a new feature in NexusTrade. Thankfully, because I've always known from the very beginning that I wanted to implement this feature, I had already done the groundwork for a successful implementation. Because of this, this implementation will be relatively straightforward, but as you can see, still has a lot of moving parts.
|
For example, we didn't even discuss the implementation of the actual indicators themselves; just how we can populate the data for these indicators. If there is interest, I can create a separate TDD for that :)
|
Additionally, even after a successful implementation, users won't be able to configure these fundamental indicator strategies within NexusTrade. Again, this requires an entirely separate design. I'll have to figure out how to populate the data within the traditional no-code UI, and also allow Aurora, the AI Assistant, to create these types of strategies in natural language. Again, I can publish another design if there is interest from you guys. Reach out to me and let me know.
|
Overall, this new feature will absolutely be a game-changer for NexusTrade. It will undoubtedly differentiate NexusTrade between other automated investing platforms, and lays the groundwork to implement extremely complex strategies. Imagine having your portfolio react to inflation data or market news in real-time. Other platforms don't even come close to the level of configurability that NexusTrade will soon offer.
|
Thank you for reading! If you made it this far, you must've liked this article, so please share it with a friend!
|
P.S. Am I emailing you too often? Kindly reply to this email and let me know. Also, don't be shy to tell me what you think about these type of emails! Your feedback here is invaluable.
|
Disclaimer: The content provided in this post is for informational purposes only and is not intended as financial advice or a recommendation to buy or sell any securities. I am not a financial advisor. The insights and analysis shared are meant to demonstrate the capabilities of NexusTrade in automating financial research. It's important to conduct your own due diligence and consult with a professional advisor before making any investment decisions.
|
|
No comments yet.